Value Study of GLAMs In Canada
Report for the Ottawa Declaration Working Group
Table of Contents
- Foreword
- Executive Summary
- Introduction
- Operating Costs of GLAMs
- Operating Revenues of GLAMs
- Value to GLAMs’ Physical Visitors
- Non-use Value
- Online Value
- Formal Education
- Wider Benefits
- Qualitative Social Benefits: Multi-criteria Analysis
- Conclusion
- Appendix 1 Economic Welfare Approach
- Appendix 2 Valuing Glam Visits
- Appendix 3 Online Value
- Appendix 4 Wider Benefits: Wellbeing
- Appendix 5 Other Wider Benefits
- Appendix 6 Questionnaire
- Appendix 7 Descriptive Statistics on Questionnaire
Oxford Economics
Oxford Economics was founded in 1981 as a commercial venture with Oxford University’s business college to provide economic forecasting and modelling to companies and financial institutions. We have become one of the world’s foremost independent global advisory firms, providing reports, forecasts and analytical tools on more than 200 countries, 250 industrial sectors, and 7,000 cities and regions.
Headquartered in Oxford, England, with regional centres in New York, London, Frankfurt, and Singapore, Oxford Economics has offices across the globe. We employ more than 250 professional economists, industry experts and business editors—one of the largest teams of macroeconomists and thought leadership specialists. Our global team is highly skilled in a full range of research techniques and thought leadership capabilities, from econometric modelling, scenario framing, and economic impact analysis to market surveys, case studies, expert panels, and web analytics.
Oxford Economics is a key adviser to corporate, financial and government decision-makers and thought leaders. Our worldwide client base now comprises over 1,500 international organizations.
Research leads on this report

Andrew Tessler, Associate Director
Andrew joined Oxford Economics in 2007 and heads up the Australian office. He has worked on a wide range of economic studies while at Oxford Economics, including economic appraisals and valuations, economic impact studies, and market analysis.
atessler@oxfordeconomics.com, + 61 2 8458 4224

Alice Gambarin, Senior Economist
Alice joined Oxford Economics in 2014, and has since gained experience in economic impact studies, including for a number of Higher Education institutions, as well as in social return on investment studies.
agambarin@oxfordeconomics.com, + 1 646 503 3054

Stephanie Lukins, Senior Economist
Stephanie is a Senior Economist at Oxford Economics who focuses on quantitative analysis. She has skills in developing deep quantitative skills, integrating econometrics and stated preference methods.
slukins@bisoxfordeconomics.com, + 61 2 8458 4230
Oxford Economics, 5 Hanover Sq, 8th Floor, New York, NY 10004.
Tel: +1 646-786-1879 Web: www.oxfordeconomics.com/consulting Twitter: @OxfordEconomics
This report is confidential to the Ottawa Declaration Working Group and may not be published or distributed without its prior written permission. The modeling and results presented here are based on information provided by third parties, upon which Oxford Economics has relied in producing its report and forecasts in good faith. Any subsequent revision or update of those data will affect the assessments and projections shown.
Foreword
Canadian galleries, libraries, archives and museums ( GLAMs) form an integral part of the fabric of our nation, enriching the lives of millions of visitors of all ages, backgrounds and regions every year.
Rich repositories of art, information, history and treasure, these precious institutions serve to preserve and promote Canadian heritage at home and abroad, while providing access to resources for education, research, learning and artistic creation.
Collectively known as the GLAM sector, ours is an industry that regularly punches above its weight. Non-profit GLAMs, whether in large cities or small towns across the country, attract world-class exhibits and provide communities with essential educational and research opportunities they may not otherwise be able to access.
For too long, members of the GLAM sector have largely operated in silos. Enter the Ottawa Declaration Working Group, comprised of sector representatives and co-led by Library and Archives Canada ( LAC) and the Canadian Museums Association ( CMA). We now recognize the importance of working together to increase the understanding of the value of our sector. We believe this first-of-its-kind study goes a long way towards that goal.
An initiative of the Ottawa Declaration Working Group comprised of sector representatives and co-led by the Canadian Museums Association ( CMA) and Library and Archives Canada ( LAC), the study found that for every dollar invested in non-profit GLAMs, society gets nearly four dollars in benefits. This return is on par with government investments in transportation infrastructure projects.
The study was conducted by Oxford Economics using metrics commonly employed by cultural institutions, as well as the results of a national survey of Canadians. It found users of GLAMs would be willing to pay $4 billion more per year to access them if required – a testament to the intrinsic value of GLAMs to Canadians.
This is a value so great, that even non-users recognize the importance of GLAMS to society at large and to future generations. Non-users said they’d be prepared to contribute $22 per year for museums, $17 for galleries and libraries and $14 for archives as a donation towards the maintenance of these institutions. This amounts to an additional $2.2 billion per year.
In all, 96% of respondents surveyed for the study said that museums contribute to our quality of life. Indeed, the study found that visiting GLAMs can be linked with improved health and wellbeing – equivalent to receiving a monetary bonus of $1,440 a year.
GLAM visits are associated with many other important societal benefits including greater literacy, curiosity, innovation, knowledge and creativity, increased rates of volunteerism and a better sense of community. These are incredibly important qualities in an increasingly divisive world.
Another way for users to interact directly with GLAMs is through their official websites, online catalogues and social media pages. The study pegged the value of these online visits at $1.6 billion per year.
It also noted GLAMs generate significant educational benefits for Canada, including through school visits which provide children across the country with important learning opportunities. The value of these visits is estimated at $3.1 billion. It was further found that academic libraries contribute an additional $3.4 billion and are associated with higher student wages and income over the working lifetime of students.
In all, it is estimated that society gains nearly $8.6 billion from GLAMs’ existence every year. That is no small contribution to Canada’s economic and social prosperity. Accordingly, the preservation, promotion and development of GLAMs should be of concern not just to those of us who work in the sector, but to all Canadians.
Ottawa Declaration Steering Committee
Jack Lohman, Royal BC Museum and President of the Canadian Museums Association, co-chair
Leslie Weir, Library and Archives Canada, co-chair
In alphabetical order:
Loubna Ghaouti, Université Laval
Paul Gilbert, Calliope Consulting
Anne-Marie Hayden, Canadian Museums Association
Chris Kitzan, Canada Aviation and Space Museum
Christine Lovelace, University of New Brunswick
Maureen Sawa, Greater Victoria Public Library
Vanda Vitali, Canadian Museums Association
Executive summary
In 2016, the Canadian Museums Association ( CMA), in partnership with Library and Archives Canada, held a summit on the value of galleries, libraries, archives and museums ( GLAMs). Oxford Economics participated in the discussion, recommending that “the broad [ GLAM] community should consider actively working together to collect data and to carry out horizontal value studies.” In late 2018, the CMA, on behalf of the Ottawa Declaration Working Group, commissioned Oxford Economics to undertake a national study looking at the value of GLAMs in Canada.
150 million
Estimated visits to Canadian galleries, libraries, archives and museums in one year. Of these, over 100 million were to public libraries and over 30 million to museums.
Canadian GLAMs receive in the region of 150 million visits every year, but they are much more than simply visitor attractions. They preserve and promote Canadian heritage domestically and around the globe, while providing access to resources for education, research, learning and artistic creation. This report aims to capture the fundamental role played by non-profit GLAMs in Canada, using a combination of quantitative value metrics and qualitative assessments of societal values.
How we assess the value of galleries, libraries, archives and museums
This study provides an assessment of the value of GLAMs using cost-benefit analysis ( CBA) within an economic welfare framework.Footnote 1 It takes a Total Economic Value ( TEV) approach, which measures the economic benefits accruing not just to direct beneficiaries such as GLAMs visitors, but to “non-users”—people who value GLAMs’ existence even if they have not recently visited one.
While assessing the costs of maintaining and operating GLAMs is relatively simple, quantifying the benefits is more difficult, requiring a range of economic techniques in line with the diversity of activities GLAMs undertake. These include a calculation of their value as visitor attractions—computed from what visitors actually pay to access GLAMs, but also an estimation of what visitors would have been prepared to pay over and above the ticket price (known as the “consumer surplus.”)
$4.0bn
Total annual “consumer surplus” of visitors to GLAMs in Canada. This is the sum of the additional amounts these visitors would be willing to pay to visit GLAMs .
To capture the non-use and broader social value of GLAMs, we undertook a national survey of 2,045 Canadian residents (hereafter referred to as the “national survey.”) Willingness to pay questions were incorporated in this survey, and quotas were imposed by sex, age, education, language (English/French), and province and territory of residence to ensure a representative sample of the Canadian population.
Value of GLAMs to their visitors
Based on the most current data, an estimated 150 million visits are made to GLAMs by members of the public each year. Some visits required an entry fee, and hence produced operational revenues for the institution. For many others, such as libraries, entry was free of charge.
Researchers use a variety of approaches to estimate the value visitors place on GLAMs. The approach adopted for physical visits in this study is the Travel Cost Method ( TCM), which estimates consumer surplus based on how demand would change if the costs of admission were to rise from current levels. This approach suggests a total physical use consumer surplus for GLAMs of $4.0 billion over a one-year timeframe.Footnote 2
$1.6bn
Total one-year value of GLAMs’ online services. The introduction of online services has seen much greater access to GLAMs information in recent years.
Non-use value of GLAMs
Beyond visitor benefits, another category of valuation represents the underlying values which Canadians hold for GLAMs whether or not they visit them. This represents the fact that, regardless of whether they visit them, Canadians value these institutions and want them to be supported. This so-called non-use value incorporates a number of components, including:
- the value that people attach to the existence of GLAMs whether or not they will ever visit them (existence value);
- the value placed on preserving GLAMs for the benefit of future generations (bequest value); and
- the value of having the option to visit GLAMs at some point in the future (option value).
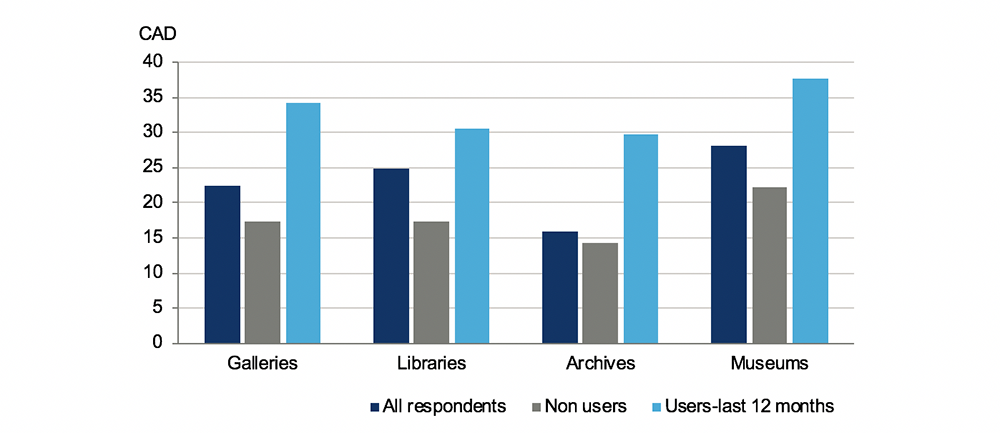
To quantify these intrinsic values, our national survey explored the maximum amount people would pay each year as a donation to maintain all of Canada’s non profit GLAMs. Respondents who did not visit GLAMs over the past 12 months stated they would be willing to contribute $22 per year for museums, $17 for galleries and libraries, and $14 for archives. Taking these values as an underlying non-use value of GLAMs for all Canadians 16 and above, we estimate a total non-use value of $2.2 billion for the entire GLAM sector in Canada.
$3.1bn
Total educational benefits to school students. This is the value of GLAMs’ educational contribution to the students and society as a whole.
Educational value of GLAMs to students
GLAMs also generate significant educational benefits for Canada, including the learning that school visits provide to children across the country. While estimating returns to education is not straightforward, economists have long recognized and measured such returns as the value that education contributes to future wages.
We adopted this method to calculate a total value for GLAMs’ educational benefits (as a result of school visits) of $3.1 billion.
The value of GLAMs’ online content
Online visits are another way for users to interact directly with GLAMs, and so constitute another form of consumer surplus that needs to be taken into account in their total valuation. We estimate GLAMs’ online value (i.e. consumer surplus) is equivalent to $1.6 billion per annum. These results include visits to GLAMs’ official websites, catalogues and Facebook, Twitter and Instagram usage, but exclude other social media portals.
$1,440
Annual value to the average GLAMs user in improved wellbeing. As measured through the health effects of GLAMs .
Wider benefits
Above and beyond the values described so far, GLAMs support wider benefits (“externalities”) which may not be captured by a user’s consumer surplus or other direct valuation approaches. Some of these wider benefits are difficult to incorporate into a cost-benefit analysis but are nevertheless important to recognize.
One wider benefit that we are able to quantify is the wellbeing effect of GLAMs. Regression modeling of our national survey data made it possible to provide monetary estimates of the equivalent wellbeing benefit conferred by GLAMs usage. These suggest the annual value to an average GLAM user is equivalent to $1,440 in improved wellbeing (as measured through health effects). In other words, visiting GLAMs has the same wellbeing effect of receiving a monetary bonus of $1,440 per annum.
Multi-criteria analysis
GLAMs provide intrinsic social values that economic frameworks cannot address. Accordingly, Multi-Criteria Analysis ( MCA) was also used to assess the perceived importance and degree of effectiveness of these attributes. Our MCA shows the general public and GLAM stakeholders tending to agree on which objectives matter most for GLAMs: while archives, galleries and museums play a key role in preserving Canadian heritage, libraries are crucial for access to research resources.
BCR 3.9
For every dollar invested in GLAMs, society gets back nearly four. Benefit cost ratio ( BCR) of GLAMs .
Cost-benefit analysis of GLAM
Combining all value components we were able to quantify as benefits, the total gross value of GLAMs to Canada is $11.7 billion a year (in 2019 prices). This estimated benefit was derived from annual costs (the operational expenditure needed to run GLAMs) of $3.0 billion. Dividing the $11.7 billion in benefits by the $3.0 billion of costs gives a benefit-cost ratio ( BCR) of 3.9. This means that for every dollar invested in non-profit GLAMs, society gets nearly four dollars in return. GLAMs perform very favourably when compared to other major social investments, such as transportation infrastructure.
It is also useful to highlight the net benefits of GLAMs; some prefer this approach as it indicates how much better off society is in aggregate. We estimate that society gains $8.6 billion from GLAMs’ existence every year.
| $million 2019 | Galleries | Libraries | Archives | Museums | All GLAMs |
|---|---|---|---|---|---|
| Revenue | 222 | 31 | 22 | 451 | 727 |
| Non-use value | 536 | 537 | 446 | 693 | 2,212 |
| Use value | 615 | 1,797 | 185 | 1,374 | 3,972 |
| Online usage | 378 | 636 | 353 | 277 | 1,644 |
| Educational value | 435 | 1,361 | 41 | 1,271 | 3,108 |
| Total benefits | 2,185 | 4,362 | 1,047 | 4,067 | 11,662 |
| Operating costs | 556 | 955 | 395 | 1,106 | 3,012 |
| Total costs | 556 | 955 | 395 | 1,106 | 3,012 |
| Benefit-Cost Ratio ( BCR) | 3.9 | 4.6 | 2.7 | 3.7 | 3.9 |
| Net benefits | 1,629 | 3,408 | 652 | 2,961 | 8,650 |
Glossary
- Term
- Definition
- Academic libraries
- Libraries that support the research and learning activities of students and academic researchers; normally attached to higher education institutions.
- AFA
- Alberta Foundation for the Arts.
- ALC
- Americans for Libraries Council.
- Archives
- Institutions that collect, preserve and provide access to records and documents of historical value.
- BCR
- Benefit-cost ratio. The ratio of total benefits divided by total costs. In this case, the ratio effectively represents the return on every dollar invested in GLAMs.
- CBA
- Cost-Benefit Analysis. The process through which the benefits of institutions or initiatives (such as GLAMs) are measured against their costs.
- CMA
- Canadian Museums Association.
- Consumer surplus
- The difference between the maximum amount that consumers are willing to pay to use a good or service (such as accessing GLAMs) and the actual cost of using it. This difference is treated as one measure of consumer benefit.
- CULC
- Canadian Urban Libraries Council.
- Current users
- Those who have used GLAMs within the last 12 months.
- CV
- Contingent Valuation. A survey-based technique used for assessing people’s valuation of resources that may not be captured by typical market measures—e.g. the value of GLAMs to those who do not use them.
- ESDS
- UK’s Economic and Social Data Service.
- Formal education
- Education that is delivered and/or supervised by trained teachers as part of a school, higher education or university curriculum, as opposed to informal learning.
- FSA
- Forward Sortation Areas. The first three characters of Canadian postal codes used to designate geographical areas.
- Galleries
- Institutions that select and preserve artworks and make them accessible to the public. By organizing exhibitions and programming, galleries advance the knowledge, understanding and appreciation of the arts, and help support research and inspire creativity.
- GDP
- Gross Domestic Product.
- GLAMs
- Galleries, Libraries, Archives and Museums.
- ICT
- Information and Communication Technology.
- Informal education
- Learning that is undertaken outside of a structured curriculum in an individual’s free time, including self-directed learning and/or learning from experience.
- LAC
- Library and Archives Canada.
- Libraries
- Institutions that provide collections of resources, especially books, used for reading and study, in addition to extensive bodies of information resources and services that may also be virtual in nature.
- MCA
- Multi-Criteria Analysis. A qualitative methodology used to provide a more holistic view of benefits. Respondents explicitly evaluate criteria used in decision-making across the key areas of interest.
- Museums
- A non-profit institution, open to the public and in the service of social development, that collects, preserves, interprets, and exhibits to the public objects of cultural, artistic, scientific, and historical value for the purposes of education, research, and enjoyment.
- Non-users
- People who have not used GLAMs within the last 12 months (or have never used them at all.)
- NPV
- Net Present Value. The net value of future benefits, less future costs, with a discount rate applied to translate these figures into today’s terms.
- ODWG
- Ottawa Declaration Working Group.
- OECD
- Organisation for Economic Co-Operation and Development.
- Past users
- People who have visited Canadian GLAMs in the past, but not within the last 12 months.
- Producer surplus
- The difference between the revenue received by the producer (in this case GLAMs) and the minimum they would have been able to produce these services for. Roughly speaking, producer surplus equates to the producer’s profits.
- PSQG
- British Public Services Quality Group.
- Public libraries
- Public libraries provide free of charge resources and services to all residents of a given community or region. Public libraries are typically funded largely by public sources.
- R&D
- Research and development.
- Social capital
- Refers to the inherent value in communities that have shared and cohesive social norms, values and understandings, which in turn facilitate greater co-operation within or among groups. Social capital may arise from social activities such as community engagement, trust in people and democratic institutions, low levels of criminality and strong civic values.
- Spill-over effects
- Flow-on effects that occur when the consequences of personal or corporate actions are not fully appreciated by those involved. Positive spillover effects might include more people volunteering or being neighbourly, inspiring others to do so as well.
- TCM
- Travel Cost Method. An economic method used to estimate the value of non-market goods such as arts and culture. The technique generally involves estimating the access costs of visitors to institutions such as GLAMs (e.g. fares, time, and entrance fees) and using this to determine their consumer surplus.
- TEV
- Total Economic Value. A measure of the economic benefits of institutions such as GLAMs to the community, which includes estimation of non-use values (i.e. the value of GLAMs to society regardless of whether individuals use them or not).
- Wellbeing effects
- The broad positive feelings that can be associated with GLAMs and which can manifest themselves in ways such as positive spiritual feelings, health, happiness, inspiration and community engagement.
- WTP
- Willingness to Pay. The maximum amount in dollar terms people would pay (or give up) in order to be able to access institutions such as GLAMs. This is one measure of the value people place on GLAMs based on their personal preferences.
1. Introduction
1.1 About this study
In December 2016, the Canadian Museums Association ( CMA), in partnership with Library and Archives Canada ( LAC), held a summit in Ottawa exploring the value of Libraries, Archives and Museums ( Taking it to the Streets: Summit on the Value of Libraries, Archives and Museums in a Changing World). The summit culminated with the creation of the Ottawa Declaration Working Group ( ODWG), including a mandate to explore and study how Galleries, Libraries, Archives and Museums ( GLAMs) bring value to Canadian society. The Summit and Declaration were the result of concerted work by Dr. Guy Berthiaume, Librarian and Archivist of Canada, supported by LAC and CMA staff.
The ODWG was co-chaired by Dr. Berthiaume and Dr. John McAvity, Executive Director and CEO of the CMA. Dr. Berthiaume, Dr. McAvity and the ODWG continued their efforts to explore the value of GLAMs, post-summit. Accordingly, in late 2018, the CMA, on behalf of the ODWG, commissioned Oxford Economics to undertake a national study looking at the value of GLAMs in Canada. The study was made possible thanks to the financial contributions of Canadian Heritage, the McConnell Foundation and Ms. Rosamund Ivey.
Throughout this report, the term GLAMs refers to the following types of institutions:
- Non-profit, public galleries whose primary purpose is communication rather than selling;
- Non-profit, public libraries in municipalities and regions, Indigenous libraries, academic libraries at Canadian post-secondary institutions, special libraries (for example, in hospitals, museums, galleries, botanical gardens, as well as serving people with disabilities) and provincial, territorial and national libraries;
- Non-profit, public archives in municipalities and regions, Indigenous archives, archives at Canadian post-secondary institutions, and provincial, territorial and national archives; and
- Non-profit, public museums in municipalities and regions, Indigenous museums, and museums at Canadian post-secondary institutions.
1.2 Benefits of GLAMs
Canadian GLAMs receive an estimated 150 million visits every year, but they are much more than simply visitor attractions. They preserve and promote Canadian heritage domestically and around the globe, while providing access to resources that support education, research and artistic creation, and play a key role in engaging communities across Canada.
This section reviews existing literature that demonstrates the value and breadth of the social benefits of GLAMs. While there are considerable overlaps across GLAM types, we present the four institutions separately to better highlight their respective strengths. Additional details on the wider benefits of GLAMs are discussed in Chapter 8, and Appendix 4 and 5 of this report.
1.2.1 Galleries
Galleries select and preserve works and make them accessible to the public. By organizing exhibitions and programming, galleries advance the knowledge, understanding and appreciation of the arts, and help support research and inspire creativity. Furthermore, galleries offer curated content designed to increase public awareness about the role and relevance of art in the past and in today’s society.
Viewing art on laptop screens and smartphones has become more and more common over the past decade, with the exponential growth of the Internet and social media. While this can be a useful tool to access artwork in the comfort of one’s home, scholars argue that art experienced in person brings about greater social and individual benefits.
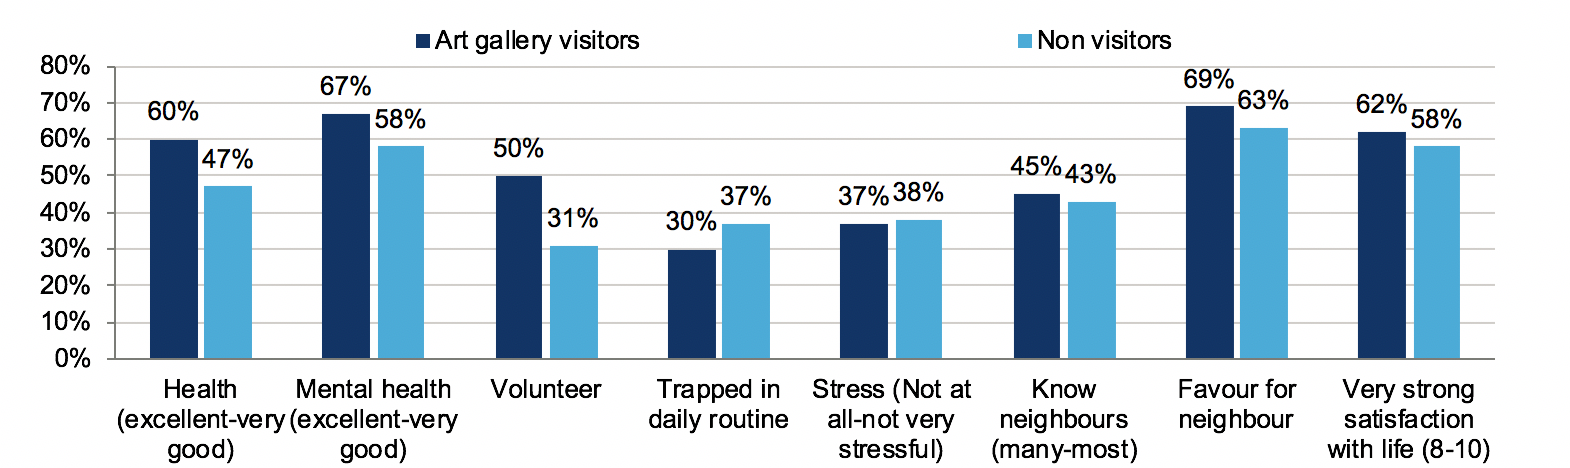
Data analysis undertaken by Hill Strategies in Canada shows that art gallery attendance has an apparent connection with several positive social indicators.Footnote 3 Fig. 2 compares gallery visitors with those who did not visit an art gallery in 2010 along a number of dimensions. Art gallery visitors were much more likely to report that they have very good or excellent health (both physical and mental) and were much more likely to volunteer.
Source: Hill Strategies
Figure description
Nevertheless, these figures did not try to control for the effect of demographic variables. Econometric models (similar to those discussed in Section 8.2 of this report) were created to inspect if gallery attendance had a relationship with individual wellbeing, above and beyond demographic features. The regression models showed that attending art galleries is linked with improved health and greater volunteer rates, even maintaining other elements unchanged (such as schooling, earnings, age, region, physical activity, etc.). In the health model, gallery visitors have a 35% higher probability of reporting very good/excellent health than non-visitors, even after controlling for other demographic characteristics. Similarly, art gallery visitors have an 89% higher probability of having volunteered in the past 12 months than non-visitors, even accounting for other factors.
More broadly, exposure to art is found to have several societal benefits.Footnote 4 Recent studies have found that life satisfaction, quality of life or happiness indicators positively correlate with participating in arts and culture activities.
One study found that participating in the arts or being an audience in the arts community is positively correlated with an increase in mental wellbeing or life satisfaction rates.Footnote 5 Earlier work also indicated that community arts programs developed social capital by increasing participants’ ability and motivation to be civically engaged.Footnote 6 This work noted that community arts programs frequently engage people from disadvantaged backgrounds (youth at risk, minorities, residents of poor neighbourhoods) and are intended for goals such as area aesthetic regeneration or teaching about multiculturalism.
In keeping with this finding, anecdotal evidence from Canada also indicates the relevance of community arts programs for youth at risk. The 2012 Calgary Power of the Arts Forum examined the example of the Calgary Antyx Community Arts, which indicates that youth use arts and culture to achieve social change. The forum included testimonials from program participants from the Calgary Youth Offender Centre and the positive effects the program created for them.Footnote 7
Likewise, a 2011 meta-study reviewed 24 articles (some of which were Canadian) of children between 3 and 16.Footnote 8 It found that partaking in organized arts activities and events enhanced secondary school attainment, early literacy skills, cognitive abilities, and transferable skills.
Lastly, a 2012 Canadian report produced by the Alberta Foundation for the Arts ( AFA) found that arts and culture contribute to flourishing and more animated neighbourhoods.Footnote 9 Maintaining a solid arts presence was deemed fundamental to sustain the wellbeing of communities and appealing to both new residents and visitors. Communities with a strong arts presence were also found to be more connected and engaged, and more likely to build positive interactions among diverse groups.
1.2.2 Libraries
Libraries are fundamental cornerstones for local communities. In addition to providing access to a wealth of resources for reading, education, and research, they help people further their skills, find jobs, and experience a strong sense of place, among many other things.
A recent study commissioned by the Arts Council of England reviewed the literature on the social and educational benefits of libraries and looked at five impact areas in detail.Footnote 10
The first impact area concerns children’s and young people’s education and personal development. Through both their core offer and targeted activities for children and young people, libraries encourage reading,Footnote 11 which, in turn, promotes language development, literacy and thus general educational attainment.Footnote 12 At the same time, libraries also directly support educational attainment.Footnote 13 Better educational attainment, in turn, leads to enhanced employability and improved health and wellbeing for children and young people as they develop.Footnote 14 Improved employability then generates economic activity and tax revenues, in turn, as well as public savings through lower welfare benefits and public health expenditure.
The second impact area is adult education, skills and employability. Through the same channels described above, libraries encourage adult reading and learning and assist job seekers.Footnote 15 These, in turn, lead to improved adult literacy and talents development, which then bring about increased levels of health, wellbeing and employability. In parallel, job seeking directly improves employability as well.Footnote 16 Better employability generates increased economic activity, public savings and increased tax income.
The third impact area has to do with health and wellbeing. By furthering reading levels among children and adults, as well as via targeted health-related activities, libraries can promote mental and physical wellbeing and sustain health service partners in supplying their services.Footnote 17 Evidence suggests that this furthers the so-called “prevention agenda,” for example via the promotion of physical activity, healthier diets, and information on the drivers of ill health.Footnote 18 As noted above, this ultimately translates into public savings.
The fourth impact area is community support and cohesion. As neighbourhood hubs, libraries offer a free, open to all and welcoming space for their local communities and service providers, in addition to making local information available for all their visitors.Footnote 19 Evidence suggests that this nurtures social capital, through higher levels of social mixing and augmented trust in people and institutions.Footnote 20
The fifth and last impact area is digital provision. Libraries sustain their communities’ digital inclusion by granting users basic access to computers connected to the Internet, as well as via targeted ICT (Information and Communication Technology) education programs.Footnote 21 This service helps to bridge the digital divide, for example through granting access to online public services and welfare provision, and through giving users the possibility to partake in online-based public and civic life. This can translate into public savings.Footnote 22
1.2.3 Archives
Archives play the fundamental role of providing evidence of past activities. Archives preserve records relating to the political, economic and social spheres of life, as well as about achievements in the arts, culture and sports, thereby helping us learn about our history and our society and increasing our sense of identity. Archives allow us to keep governments accountable for their actions, and also often help ensure that justice prevails. However, existing studies addressing the social benefits of archives are rather limited, as detailed in the rest of this section.
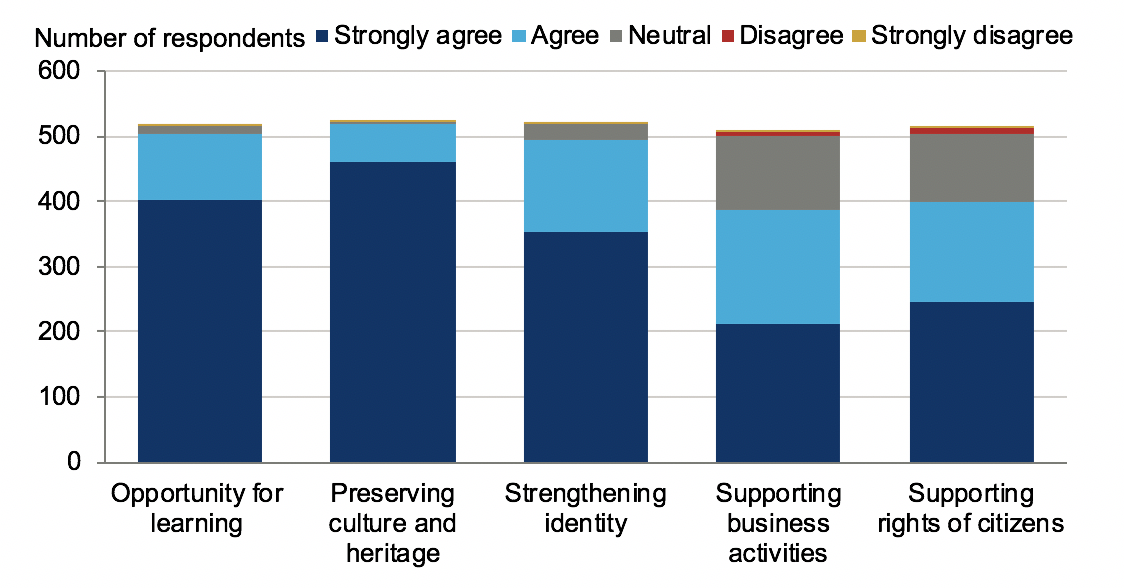
Yakel et al. (2012) analyzed data from 23 government archives in Canada, which agreed to administer a survey to every in-person visitor during a two-week period.Footnote 23 In the questionnaire, the authors asked respondents to provide their opinion of the social impact of archives based on five dimensions: opportunity for learning, preserving culture and heritage, strengthening identity, supporting business activities, and supporting the rights of citizens. The survey provided a scale from 1 (strongly agree) to 5 (strongly disagree); Canadian respondents overwhelmingly agreed with all the dimensions (Fig. 3). Backing for archives as preserving culture and heritage attained the top position with an average score of 1.13, while support for business activities collected bottom place with an average score of 1.84.
Source: Yakel et al. (2012)
Figure description
Similar results are found in the British Public Services Quality Group ( PSQG) survey of visitors to archives, which asked respondents to evaluate archives’ contribution to society along several similar dimensions (Fig. 4).
Percentage who agrees/ strongly agrees
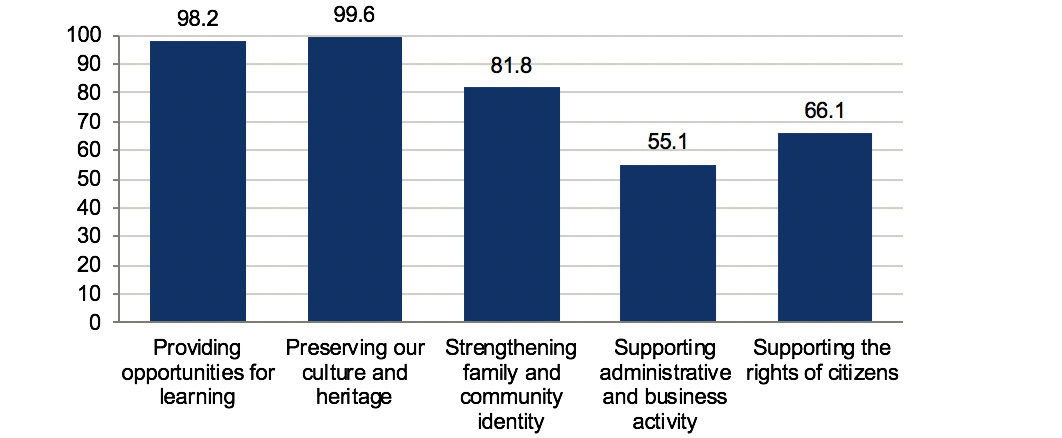
Source: 2004 PSQG
Figure description
In addition to wide-ranging societal impacts, the 2002 PSQG survey provided further information on the perceived personal impacts on archives users (Fig. 5).Footnote 24
Percentage who agrees
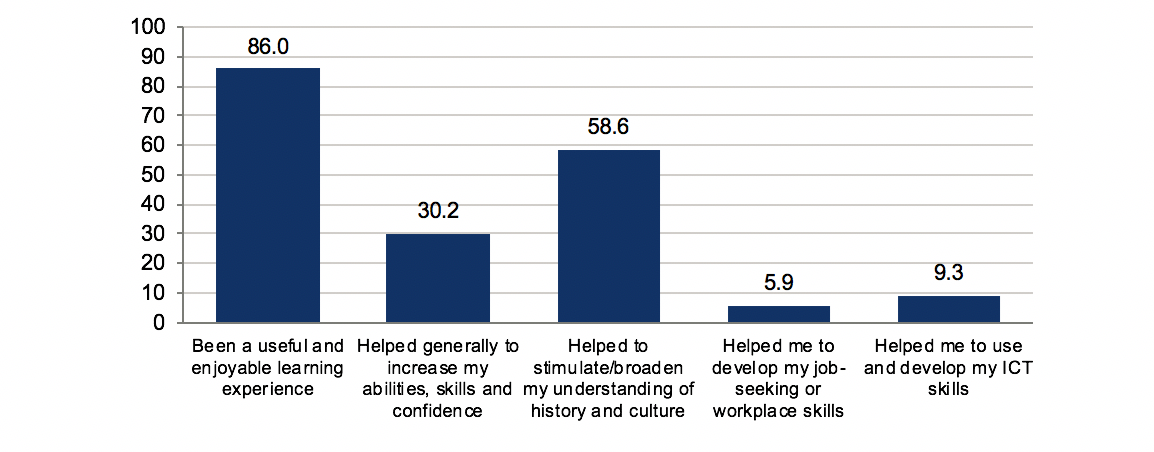
Source: 2002 PSQG
Figure description
Lastly, UK evidence suggests that archives can make a significant contribution to the promotion of social inclusion. This happens through both the development of personal identity (several respondents highlighted the significance of evidence on births, marriages, deaths as means to maturing a sense of identity and self-confidence) and community identity (community engagement with archives can inspire not only a sense of belonging and interest in history but can also work as a promoter to civic participation).
Through their key function as providers of information in the democratic process and exercise of informed citizen’s rights, archives can also play a unique part in addressing the government objective of social inclusion.Footnote 25 Last but not least, anecdotal evidence from UK focus groups suggests that archives offer newly arrived members of a community the possibility to put down roots.Footnote 26
1.2.4 Museums
Museums have the fundamental role of narrating the story of humankind and nature over the centuries.Footnote 27 They showcase objects made by nature and by man, holding the cultural wealth of towns, cities and nations. In the early 2000s, a survey of 2,400 Canadians was launched to collect information on people’s views of museums.Footnote 28 The survey found that the vast majority of respondents thought museums play a valuable role in showcasing and explaining Canada’s artistic achievements (94%) and achievements in science and technology (96%). Some 97% believed museums play a valuable role in explaining Canada’s natural heritage, and a similar proportion thought museums play a critical role in preserving objects and knowledge of Canada’s history. These results are likely to hold true beyond Canada; for example, evidence from the UK suggests that museums hold reminders of common societal events and therefore help in constructing a communal memory.Footnote 29
The presence of original objects in museums also contributes to make them trustworthy in the eyes of their users. In their study, Conrad et al. (2009) investigate how Canadians engage the past in their day-to-day lives. As part of the data collection, they asked survey respondents to reflect on the trustworthiness of sources of information about the past.Footnote 30 Museums were rated as the single most trustworthy source by more than 40% of the respondents. Three reasons appeared to justify this choice: the availability of artefacts and primary documents; the conviction of museums’ neutrality since they are run by professionals; and the assurance derived from using multiple sources of information.
An astounding 96% of respondents to the Canadian survey on museums also reported believing that museums contribute to quality of life. This positive impact is widely acknowledged in the literature. For example, Silverman (2010) suggests that museums contribute to health and wellbeing through: (I) encouraging relaxation; (II) an instant positive change in physiology and/or feelings; (III) promoting contemplation, which can have positive effects on mental health; (IV) promoting health education; and (V) performing the role of public health advocates and improving health-care environments.Footnote 31
A prominent example of these effects is the recent art therapy program at the Museum of Fine Arts in Montreal, where doctors have started prescribing visits to the museum to people living with either mental health issues, autism or eating disorders, or with difficulties related to learning, living together and social inclusion.
Academic research on psychiatric patients also showed that museum objects might be able “to assist with counselling on issues of illness, death, loss and mourning, and to help restore dignity, respect and a sense of identity.”Footnote 32 Numerous articles also find that museum interventions have positive effects on emotional wellbeing, with reported outcomes including a sense of connection, and belonging, skills improvement, optimism, a sense of hope, and self-esteem, among others.Footnote 33 Some authors, on the other hand, have focused on museums’ role as agents to boost social inclusion and diminish socially excluding habits across communities, by offering environments and practices to re-examine conduct, manners and opinions.Footnote 34
Last, but not least, museums play a fundamental educational role for adults and children alike. Some 68% of respondents to the above survey on Canadian museums reported seeing these institutions as offering both an educational and recreational experience, in addition to the 15% who see such trips as purely educational.
Around 92% of all respondents believe it is important for children to be exposed to museums. A recent literature review found increasing proof that museum exhibitions, when supported with facilitating activities, can positively affect children’s science attitudes, teamwork, communication skills, as well as critical thinking skills in history, science, arts and humanities.Footnote 35
For instance, Burchenal and Grohe (2007) study the impact of adopting Visual Thinking Strategies (VTS), an approach used in both classroom and museum settings to promote the development of critical thinking.Footnote 36 By focusing on informal communication between a museum educator and students, VTS begin with questioning children, urging them to present supporting arguments in favour of their ideas. By carefully studying and debating artistic objects, children had the chance to relate previous experiences and knowledge to make sense of artwork on their own terms. The authors showed that the VTS method was effective at supporting the development of children’s critical thinking.
1.3 Quantifying the benefits of GLAMs
The aim of this study is to quantify the benefits of GLAMs to society, and to set these benefits in context by comparing them to the sector’s operating costs. While the costs are readily available from Canadian Heritage and Canadian Public Library statistics, quantifying the full value of all the benefits the sector generates is less straightforward.Footnote 37 To estimate them, we therefore need to deploy sophisticated analytical techniques, as explained below.
In many cases, the economic benefits or value of a company or institution can be measured in terms of market metrics such as their contributions to “Gross Domestic Product” ( GDP) and employment. But while these metrics are well recognized and understood, they represent only a part of the value generated by some types of economic activity––particularly in the case of museums and other cultural institutions. Many cultural institutions employ only small numbers of people, and their contribution to national GDP may also be small. However, their social value often far outweighs this “direct” contribution, highlighting the need for a better method of capturing the value they produce, both for society and the people who visit them.
A “Total Economic Value” ( TEV) assessment is the ideal approach for this goal.Footnote 38 Set within a framework of economic welfare (rather than a national accounts approach, which forms the basis of GDP), TEV assessments are a form of cost-benefit analysis that seeks to establish and aggregate the different values accorded to an institution or a sector by society. In the case of GLAMs, the benefits fall into two main types: direct use value and non-use value (Fig. 6). We will now consider each of these in turn.
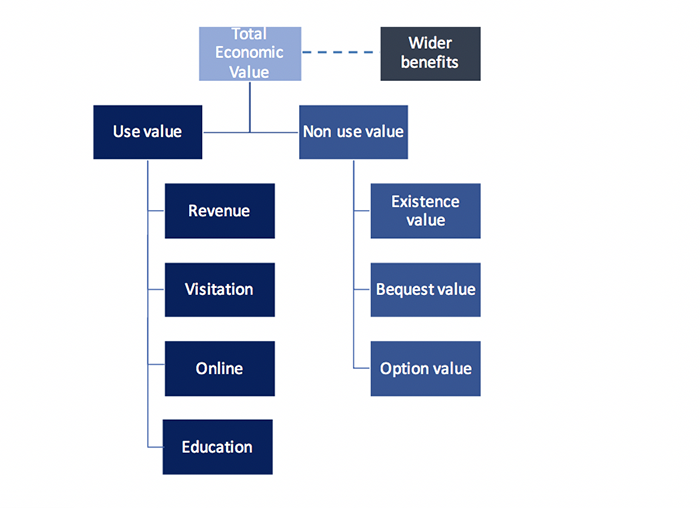
Figure description
1.3.1 Direct use value
Direct use value is the value placed on GLAMs by the people who use them. This value is calculated based on a combination of information about the users of the services provided by GLAMs, as well as on data about the revenue generated by GLAMs from fees paid by users.
A major component of direct use value is physical use value. Conceptually, this represents the sum of visitors’ “willingness to pay” to visit GLAMs. In practice, visitors’ willingness to pay is calculated by adding together:
- the cost people actually pay for a ticket to enter GLAMs (if applicable); and
- the difference between that cost and the maximum amount visitors would have been willing to pay to visit the GLAM. This difference is known as their “consumer surplus.”
This approach is based on the assumption that people’s individual valuations of their visits typically exceed the costs they face in making them. It is thus very different from simply taking market prices as a guide to an institution’s value.
If visitors to GLAMs placed a value on their visit that was exactly equal to the cost of entry, then what they gave and received from each visit would be equivalent, and they would be indifferent between visiting or not visiting. In reality, they visit because they feel they get value from the experience that exceeds the pure cost of the visit, making the visit worthwhile. In economic welfare, this additional value is measured as the consumer surplus.
For example, a visitor may pay the $10 entry fee to visit the New Brunswick Museum in Saint John but enjoy it so much that he/she would have been prepared to visit even if the ticket price had been $15. The consumer surplus for such a person would be $5. If a second visitor is only willing to pay $12 to visit, his/her consumer surplus would be $2. In this way, consumers capture benefits over and above the prices they pay to visit GLAMs.
By calculating the visitors’ consumer surplus and adding this to the price they pay for a ticket to enter the GLAM, we can estimate the “direct use value” that visitors place on the institution.
A variety of other methods are used to calculate other aspects of direct use value such as revenue, online value and educational value, as detailed in later chapters of this study.
1.3.2 Non-use value
Non-use value accrues to people who do not visit GLAMs, but who nonetheless obtain value from it. We consider three types of non-use value:
- “existence value”—capturing the fact that many people will value the very fact that GLAMs exist, and will be willing to contribute to their maintenance, even if they have no intention of visiting them;
- “bequest value”—which captures the importance people place on the institutions as repositories of art, scientific production, historic heritage and literature for the benefit of future generations; and
- “option value”—which captures the value people place on having the option of visiting GLAMs, even if they have not visited them yet.
To a large extent, these non-use value sentiments overlap and cohere for many citizens and are therefore best considered as a group.
1.3.3 Wider benefits
As well as direct and non-use values, another category of value may be classified as wider benefits. These are values which—while potentially quantifiable—are not incorporated into the TEV for various methodological or conceptual reasons. Nonetheless their importance should be noted, and these are considered in a later chapter of this report.
1.3.4 Cost-benefit analysis
Once we have quantified all the aspects of value described above, we are able to set the social valuation of GLAMs against the costs of operating them. This process is known as cost benefit analysis ( CBA). Dividing benefits by costs allows us to establish a “benefit-cost ratio” ( BCR) for the sector, and for individual types of institutions. Put simply, a BCR above 1.0 indicates that the benefits of an investment in an initiative or institution (such as GLAMs) outweighs the costs to society. This may also be thought of as a form of return on investment (RoI) to society.Footnote 39 We can also deduct costs from benefits over time to estimate Net Present Value ( NPV).
A note on economic welfare and economic impact approaches
As indicated above, a TEV follows an economic welfare approach and includes both market and non-market impacts. This is different from an economic impact approach, which measures market-based factors such as GDP and employment and employs economic multipliers. The two overlap in some areas but start from different assumptions and measure different things.
Economic welfare is focused on returns (i.e. BCR or RoI) on a given social investment (usually the amount spent on operating costs and capital but sometimes items such as time costs) and can include market and non-market values, such as non-use value. It asks how a given initiative or institution improves economic efficiency (productivity), but also what the impact is as measured by people’s welfare in terms of things that are not always traded in markets (e.g. non-use value). So, it allows for a “decision rule” about whether a social investment is worthwhile or not (i.e. a BCR and/or NPV).Footnote 40
Impact analysis is focused on market measures such as jobs and GDP which might be of particular interest in some policy contexts. While there is some overlap, some items included in an economic welfare approach are excluded from impact analysis and vice versa. Put another way, economic impact studies measure economic activity in terms of contributions to the economy as a whole, or the share of the “economic pie” accounted for by institutions such as GLAMs. By comparison, economic welfare studies measure how society is better off in terms of net benefits (benefits less costs), i.e. how institutions such as GLAMs grow the “economic pie”. Neither is “better” than the other; they measure different things. Appendix 1 provides further details on the economic welfare approach adopted in this study.
| Included as benefit in economic welfare study? | Included as benefit in economic impact study? | Comment | |
|---|---|---|---|
| Producer surplus (profit) | Yes | Yes | Part of GDP. |
| Consumer surplus | Yes | No | Not traded in a market. |
| Long term productivity effects (e.g. education) | Yes, where quantifiable | No | Impact assumes constant productivity. |
| Non-use value | Yes | No | Not traded in a market. |
| GDP | No | Yes | GDP is a key impact metric. |
| Employment | No | Yes | Employment is generally treated as part of (operating) costs under a welfare approach. |
| Provides a decision rule | Yes | No | A BCR above 1.0 indicates benefits of investment outweigh costs. |
Source: Oxford Economics
Operating costs of GLAMs
To deliver their services and programs, and to operate their facilities, GLAMs incur substantial operational and maintenance costs. These costs are paid for by public bodies (through taxes), private companies (through sponsorship), and the ticket revenues of visitors.
We estimate the GLAMs sector incurred operating expenses of $3.0 billion in 2019. More than a third of this total related to the cost of running museums, almost another third related to libraries (Fig. 8). The cost of running art galleries and archives together contributed a further third of the sector’s expenses.
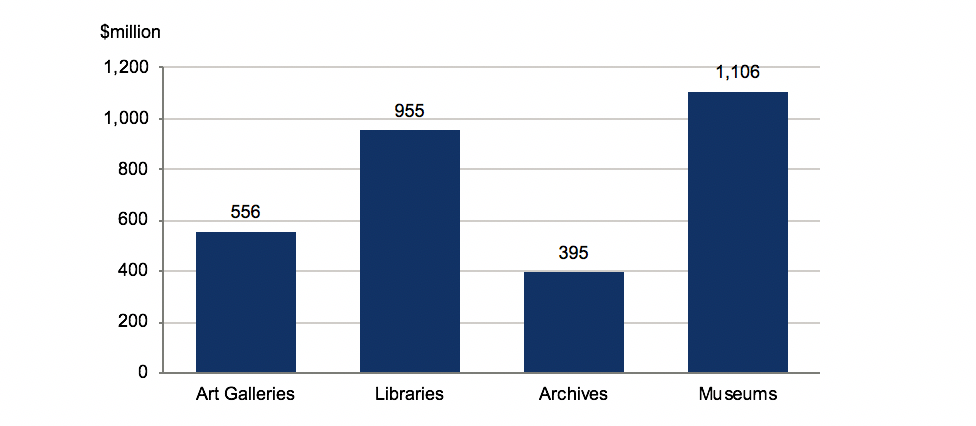
Source: Canadian Heritage, Canadian Urban Libraries Council, Oxford Economics
Figure description
Operating revenues of GLAMs
The most obvious component of value created by GLAMs is the element of visitor value claimed in the form of entry and membership fees. We estimate these revenues equated to $725 million in 2019, of which the vast majority (93%) can be attributed to museums and galleries, as one would expect.
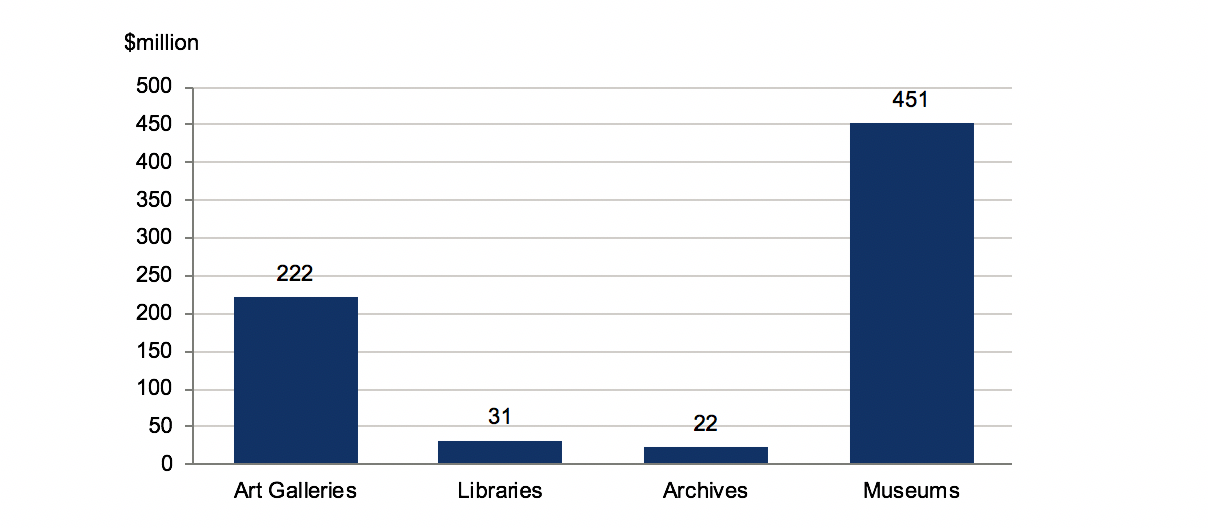
Source: Canadian Heritage, Canadian Urban Libraries Council, Oxford Economics
Figure description
Value to GLAMs’ physical visitors
4.1 Background
This chapter explores the valuation of GLAMs using an approach known as the travel cost method ( TCM). The TCM has been widely applied to the study of cultural and environmental sites across the world.
Note that the value of academic libraries is estimated separately (in Section 4.3) as a number of unique considerations apply to those institutions.
4.2 Travel cost models
A number of techniques have been used in the academic literature to estimate the “direct use” value of visitors to a cultural attraction––including simply surveying visitors, to establish how much they say they are willing to pay to visit the attraction. However, a potential drawback to this approach is that people may understate their true valuation and may think the survey foreshadows increases in ticket prices by the institution.
A well-established alternative approach is to examine visitors’ actions for clues about the value they place on the cultural institution. Methods that follow this approach are known as “revealed preference” techniques.
One such technique is to develop a “travel cost model” ( TCM). Visitors to GLAMs come from all over Canada (and the world), and the further they travel to visit the institution, the greater the travel costs they will have incurred. A TCM uses econometric analysis to exploit these patterns to understand how people’s propensity to visit GLAMs falls away as the travel costs involved increase. From this analysis, it is possible to estimate a visitor’s consumer surplus. This can then be added to the cost of a ticket to the GLAM, to calculate the visitor’s true valuation of the institution. This is the approach we have used in this study.
To develop travel cost models for GLAMs, we required information on the origins of their visitors. Several institutions collect information on visitors’ places of residence when they purchase a ticket or access a service.
A TCM is based on the insight that travelling to visit an attraction, such as a museum or a gallery, involves costs other than the formal entry fee. A visitor driving to a GLAM would face costs in terms of fuel consumption, other vehicle costs, parking costs, and the “opportunity cost” of their time spent travelling. The net value from a visit to the GLAM which remains after travel costs have been taken into account will therefore be substantially greater for someone who lives five kilometres away than for a similar person living 100 kilometres away. In our analysis, we can use these variations in travel costs as a proxy for different entry fees to GLAMs.
The degree to which visitors living further from GLAMs become more scarce allows us to infer how sensitive the typical visitor is to changes in the cost of visiting the institution. Once we understand the magnitude of this sensitivity (technically known as the “price elasticity of demand” or often just “elasticity,”) we can calculate the maximum amount that visitors would have been willing to pay to visit the GLAM. The difference between the maximum visitors would have been willing to pay and the actual access price to enter the GLAM is known as their “consumer surplus.”
For this project, we developed bespoke “Zonal Travel Cost” models for a variety of institutions.Footnote 41 A zonal model divides the country into concentric zones around the GLAM and, by observing the place of residence of visitors, determines the visit rate per number of inhabitants in each zone.Footnote 42 For example, if 200,000 visitors to the museum live in a zone defined as between 10-20 kilometres driving distance to a GLAM, and the total population in this zone is one million, then the visit rate per thousand of population is 200. The zone between 50-70 kilometres might be home to 50,000 and have a population of three million, yielding a visit rate of 17 per thousand of population. In this example, the zone that is further away exhibits a lower visit rate due to the higher costs associated with reaching the site, in line with what we would expect to see.
Based on individual GLAMs’ data on Canadian visitors’ places of origin, we were able to estimate the number of visitors coming to each institution from hundreds of Forward Sortation Areas ( FSA) around Canada. Drawing on Statistics Canada data, we were then able to identify the population living in each area, and therefore calculate visit rates. Finally, using a Google mapping algorithm, we established the travel time (and distance) from each FSA to the GLAM under consideration. To do this, we made the following simplifying assumptions:
- While all visitors to GLAMs were included in the analysis, for the purposes of assigning travel and time costs, a “day trip” cost boundary of 250 kilometres from the relevant institution was set. Trips originating within this boundary were assigned to zones as described above. Trips originating from outside the boundary were assumed to have a similar pattern of trips to those inside it and assigned to zones within the boundary accordingly.Footnote 43
- Visitors who traveled less than 2.5 kilometres walk to the GLAM.
- Visitors living further than 2.5 kilometres away can choose between driving and transit and they base their decision on the difference in travel time between these two modes of transport (if the difference is over 25 minutes, they will select driving).
These assumptions were created to mimic as closely as possible the transport mode patterns found in our national survey of the Canadian population.
For each individual GLAM, we were then able to group FSAs, visitors, and population into 10 zones for which visit rates were determined. For each zone, we estimated the total per-person travel costs, comprising:
- Direct travel costs––including fuel, maintenance, tires and parking costs of driving to GLAMs, based on information published by the Canadian Automobile Association and Parkopedia.Footnote 44 For visitors who use public transport instead, we calculated the local average fare using single ticket cash fares for adults, youth and seniors and weighting the fee based on population age patterns. Lastly, no direct travel cost is associated with walking to GLAMs.
- The value of time needed for the journey––based on standard values of time from Statistics Canada.Footnote 45 For museums and galleries, we assumed the value of time is equivalent to half the hourly salary, to reflect the leisurely nature of the activity. For libraries and archives instead, we used Canada-specific assumptions on the proportion of users who visit the institutions for work or research purposes and used the full hourly wage for these visitors.Footnote 46
Based on these travel zones and visit rates, we were able to infer how sensitive visitors are to changes in the cost of going to GLAMs, and the maximum amount they would be willing to pay to visit an institution. When these data are displayed graphically, it is known as a demand curve. An example demand curve for visitors to GLAMs, based on a selection of simulated rises in ticket (or other access) prices, is shown in Fig. 10.
The demand curve shows that when the additional entry cost is zero (i.e. the entry cost is the same as at present) there are as many visits as there are at present. As the entry cost increases, the number of visits declines. While the number of visitors is initially very sensitive to small changes in the cost of visiting GLAMs (at the right-hand end of the curve), the degree of sensitivity (or “elasticity”) declines as the additional cost increases. For example, an increase in the additional cost of a visit from zero to $10 would be expected to approximately halve the number of visitors, whereas further increases in the additional cost would have a much smaller impact on visitor numbers.
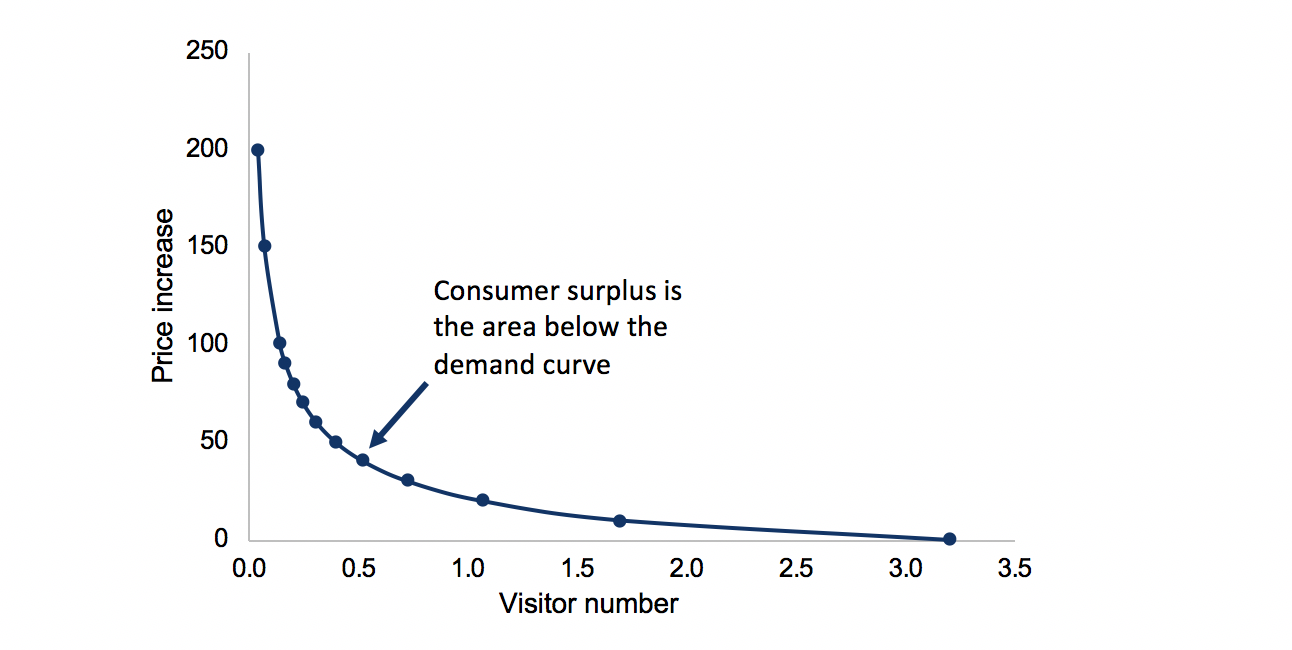
Source: Oxford Economics
Figure description
Estimation of demand curves therefore offers a powerful tool for GLAMs analysis. These curves provide information on how much people value GLAMs and how many people would be willing to use them at different price levels. This could be of particular interest to ticketed venues, but also in situations where access conditions change for all venues (e.g. it becomes more/less costly to access GLAMs).
Moreover, the demand curve incorporates people’s preferences to use GLAMs for whatever purpose they choose (e.g. reading books, researching jobs, viewing art). It also incorporates people’s preferences to use GLAMs rather than pursue alternatives. For example, people may use public libraries, which have no entry fee, but if there was such an entry fee, they may seek alternatives (e.g. buying books).
The demand curve’s shape, as measured by its sensitivity to price changes (or elasticity) tells us how appealing GLAMs are against those other alternatives, and what would happen if indeed such a fee was levied. In doing so, it shows us how people may trade off the use of their resources (time and money) and so provide the key to valuing GLAMs.
The demand curve can also be used to estimate the consumer surplus of GLAMs visitors by looking at the impact on visitor numbers from different simulated increases in the cost of visiting. In essence, the total area underneath the demand curve is equal to the difference between the actual cost and the maximum amount visitors would have been willing to pay to visit the institution. This is the consumer’s “profit” or consumer surplus as discussed above.Footnote 47 The various models yield a range of consumer surplus estimates, which vary both by the type of institution, but also by the geographical location and the size of the institution (urban vs. rural, small vs. large, etc.).
In addition to individual GLAMs’ travel cost models, we also developed “supermodels” (national models) from the national survey for each institution category. These national models offer a “top down” approach using national survey data, as opposed to the “bottom up” approach using the behavioural data drawn from the various GLAMs. The national models cover a much broader sweep of the population and so are a useful complement to the individual bottom up models. Another important feature of these differing modelling approaches is that the national models use people’s reported travel costs (along with the defined values of time developed above). The national models therefore reflect perceived travel costs, whereas the bottom up models reflect what is sometimes referred to as “researcher defined costs.”Footnote 48
For museums and galleries, combining bottom up results with our national model ones suggests that the average value of each visit is $44. Canadian Heritage 2015 data (the latest available) suggest a total of 45.6 million visits to non-profit galleries and museums in Canada; 31.5 million to museums and 14.1 million to galleries.Footnote 49 Multiplying the consumer surplus of each visit by the total number of visits provides an estimate for the total value of Canadian galleries and museums to their users. Our estimates suggest that galleries and museums generate a total annual consumer surplus of $2.0 billion.
For archives, visitation data are more limited, as the area is less well studied. However, we were able to overcome this to some extent by gaining access to supplementary data. Our estimates relied on four main sources. We utilized information from (1) the University of New Brunswick’s Archives & Special Collections and (2) Ontario Archives, as well as (3) developing a “supermodel” (national model) from the survey results. As a fourth and last data source, we obtained visitor origin data from the archive visitor survey undertaken by Yakel et al. (2012).Footnote 50 This included 468 usable responses on visits to 23 Canadian archives, nationwide. This last source would appear to represent one of the richest available data sources on archival visits in the world.
Combining the four models, we estimate a consumer surplus of $65 per visit or $185 million nationally. Evidence suggests archives’ in-person visitors are likely to be particularly determined—especially given the increasing availability of online access.Footnote 51 This helps explain the much greater consumer surplus per visit we identified.
Lastly, for libraries, we have sourced data to develop TCMs for the Hamilton, Kitchener, Regina, and Vancouver Public Libraries. We also supplemented this with a “supermodel” (national model) drawn from the national survey results. Combining these two suggests a consumer surplus/visit of $18. Multiplying this figure by the total visits to public libraries from the Canadian Urban Libraries Council (hereafter, CULC), scaled up to include all public libraries, yields a total value of $1.8 billion per year.Footnote 52 The figure below provides a summary of physical use values.
| Item | Galleries | Libraries | Archives | Museums | Total |
|---|---|---|---|---|---|
| Average physical use value per visit $(1) | 43.6 | 17.6 | 65.2 | 43.6 | |
| Estimated visits 2019 (million) (2) | 14.1 | 102.2 | 2.8 | 31.5 | |
| Physical use value $(million) (3) = (1) * (2) | 615 | 1,797 | 185 | 1,374 | 3,972 |
Source: Oxford Economics
All figures subject to rounding
4.3 Academic libraries
The discussion above relates to the estimation of the value of physical visits to GLAMs including public libraries. However, it does not include estimations of visits to academic libraries. Academic libraries have a different usage base, purpose and character to public libraries.
In addition, many of their users are students and some students live on campus. The students who live on campus do so because that is where they have gone to be taught and to use campus facilities—including the library. This creates what is technically known as an “endogeneity problem”—the users’ choice of living location is not independent of the facility they are using but is at least in part governed by it. The TCM generally assumes that the choice of living location is “exogenous” or independent of the facility—e.g. we assume that most users of galleries do not deliberately live close to an art gallery (though of course in a broad sense, the gallery may be one of many things that attracted them to live in a town or city).
Another issue is that many of the benefits of academic libraries are educational and educational benefits may only play out in the long term.
Therefore, we have not used the TCM to measure the benefits of academic libraries but instead have chosen a different approach. There have been many attempts to measure the value of academic libraries. Many of these focus on measures such as student retention and/or superior academic performance as a result of high usage of academic libraries.Footnote 53 However, these may only capture part of the benefits of academic libraries. For example, high usage of academic libraries may improve student grades but all students (including low usage students) may ultimately get a benefit.
Academic libraries are effectively embedded in university education. Accordingly, the approach adopted in this study is to see academic libraries as a part of the broader benefits offered by a tertiary education over the long term.Footnote 54 If that is the case, then academic libraries would account for a share of student benefits from such an education. Of course, faculty also use these institutions and an allowance is also made for the benefits of faculty usage of such facilities. The approach taken is detailed in the box below. This approach suggests a BCR for academic libraries of about 3.4, with an NPV of $3.4 billion.
Because of their quite different character, we have nonetheless separated out results for academic libraries from public libraries, as some may feel mixing these in with public libraries reduces transparency and may blur the quite distinctive character of each institution. The main BCR and NPV results presented in the Executive Summary and Conclusion therefore only detail public library results (i.e. exclude academic libraries).
Assessing the value of academic libraries
The approach to the estimation of academic libraries was based on estimation of the long term returns to university education in Canada. Academic libraries are part of a mix of learning that occurs in universities and so would be expected to be responsible for a share of the benefits. Given data on the return to university education in Canada, and attribution of library share of costs, this allows for the calculation of a BCR and NPV for student usage. In addition, allowance can also be made for academic usage to estimate a combined total.
Students
The following approach was adopted to assess benefits from student usage:
- Data sourced from the Organisation for Economic Co-Operation and Development ( OECD) was used to calculate the total social costs and benefits of a Canadian university degree over the working lifetime of students.Footnote 55 These include both the private costs and benefits (e.g. fees, employment income forgone, higher future wages) and public ones (government subsidies, future tax income).
- Based on OECD data, the present value of costs is $89,249 and that of benefits is $297,764 over the lifetime of a typical Canadian student.Footnote 56 This equates to a 3.3 BCR, which implies the social benefits of a Canadian university degree are 3.3 times the costs.
- The next question is how to apply these results to academic libraries. Given that benefits are 3.3 times costs, there is a need to estimate library costs. Data from the Canadian Association of Research Libraries (hereafter, CARL) was used to estimate academic library running costs (an adjusted $737 million in 2016-17).Footnote 57
- However, the benefits cited above result from society incurring not just direct costs (running costs recorded by CARL) but indirect ones (forgone income while studying).
- Based on the estimates above, we calculate that indirect costs account for 47% of total social costs. Accordingly, total social costs attributable to CARL libraries were assessed at approximately $1.4 billion per annum.
- Given a BCR of 3.3, this suggests total social benefits of $4.7 billion from academic libraries and an NPV of $3.3 billion.
Faculty
Faculty benefits were determined based on the work of King & Tenopir (2008).Footnote 58
- King and Tenopir undertook contingent valuation work in five US universities finding that scholarly journal usage is by far the most common academic library activity undertaken by faculty. Accordingly, their study concentrates on the annual usage of scholarly journals in academic libraries.
- This work is in some ways a parallel to the student benefits above. It incorporates both private access costs (annual faculty wage costs of $US 704 per person) along with costs to libraries of purchasing and maintaining journal collections ($US 1,052 per faculty member in total). It also includes the benefits of usage, given the cost of obtaining the data from alternative sources ($US 3,466 per faculty member per annum).Footnote 59 A BCR of 3.3 is recorded.
- Since the costs of journal collections are already included in the student usage above, only the academic faculty time costs are included in the calculations for the current study.
- The number of academics at CARL institutions was estimated based on CARL data indicating 845,782 students at these institutions and using an average student faculty ratio of 20.Footnote 60 These calculations produce a total of 42,289 academics at CARL member universities. Adjusting the 2008 $US faculty values to 2019 Canadian values, in turn, suggests $216 million in annual benefits and $43.9 million in costs for academic library usage by faculty (excluding library running costs).Footnote 61
Results
The combined results from the student and faculty estimates above suggest that the total benefits equate to $4.9 billion and total costs to $1.4 billion in present value terms. This suggests a BCR of 3.4 for academic libraries (and a net present value of $3.4 billion). Note this result largely reflects the long-term benefits of these libraries as they contribute to higher student wages and government income over the working lifetime of students.
Non-use value
5.1 Background
In assessing the value of GLAMs, it is important to pay attention not only to their direct usage but to a broader set of values above and beyond such usage. Whether or not they use GLAMs, people may value them simply for “being there”—i.e. the fact that GLAMs exist and it is good that society does these sorts of things. Or they may see value in ensuring GLAMs are preserved for future generations. Or perhaps they wish to use GLAMs “one day” and want to keep that option open.
This collection of values is often known as “non-use value” or “passive use value.” Non-use value is in fact fairly intuitive; societies are prepared to subsidize a range of activities over the longer term. Apart from the arts, another example might be subsidies for services in remote communities. Most people would not be citizens of such communities, or ever expect to use these services. Nonetheless, they might be happy to fund such services on equity or other grounds. They might see such subsidization as part of what society does. Likewise, society’s willingness to subsidize cultural assets over the longer term may be seen as an implicit indication of non-use value.
Non-use value is commonly estimated for environmental or cultural amenities, which are often seen as intrinsically valuable by citizens. Past studies have found that non-use values can account for a substantial proportion of the benefits of a cultural or environmental asset.
In the case of GLAMs, non-use value can be seen as consisting of three different components:
- Existence value—The value people attach to the existence of GLAMs despite the fact that they may have no intention of visiting them.
- Bequest value—The value that people place on GLAMs as a benefit to future generations.
- Option value—The value people attach to having the option of visiting GLAMs at some point, whether or not they ever exercise that option.
In practice, people may have a mix of all three of these components in mind when assessing non-use values in situations such as those discussed in our national survey and it may be difficult to disentangle one from the other.
The importance of non-use value to cultural institutions has been demonstrated in jurisdictions such as Detroit, where voters, the private sector and government acted to prevent the sale of part of the collection of the Detroit Institute of the Arts (DIA) during a time of financial crisis. This involved providing over $US 800 million in funding under what came to be known as the “Grand Bargain.” Given that the majority of the public were unlikely to be users of the facility, the fact that society was willing to pay such amounts to retain its art collection during a time of financial crisis provides a “real world” example of the role of non-use value in respect of cultural assets.Footnote 62
Non-use value can be measured through the use of a public survey, employing a survey technique known as contingent valuation ( CV). A CV assessment was carried out as a part of the national GLAMs survey described above.
5.2 National survey
By definition, non-use value is not traded within a market, since it relates to the way people value something they do not directly pay for or use. So, in order to measure non-use value for GLAMs, a national survey of the general population had to be conducted. The established approach for such surveys is to focus on people’s “willingness to pay” ( WTP) for cultural assets and this was followed here.
As indicated, WTP questions were therefore incorporated into the online national survey of the Canadian population, described above.Footnote 63 Survey quotas were imposed by sex, age, education, language (English/French) and province or territory of residence in order to ensure a broadly representative sample of the Canadian population. A total of 2,045 completed responses were received from Canadian residents. The survey questionnaire was informed by recent literature on contingent valuation approaches.Footnote 64
The national survey included current users of GLAMs (i.e. those who had used such facilities within the last 12 months), as well as non-users (i.e. those who had not used GLAMs within the last 12 months or had never used them at all). The non-users are of particular interest here, since they could value GLAMs even though they do not use them. This can be interpreted as a sign of society’s underlying non-use value for GLAMs (across both current users and non-users).
The survey results were then used to assess WTP across the various institutions and GLAMs as a whole. The approach to doing so is described in the box below.
Assessing the non-use value of GLAMs
The national survey asked all respondents (i.e. both current users and non-users) about their willingness to pay ( WTP) for the four defined types of GLAMs.Footnote 65
Care needs to be taken in setting questions about cultural resources such as GLAMs. Analysts need to bear in mind the fact that unlike goods that people buy on an everyday basis (e.g. grocery shopping) people are not always familiar with the “price” of the resource in question. In addition, there is the risk of people providing very high WTP responses because “talk is cheap” (“hypothetical bias”) or saying they would pay too little because they think they might be saddled with new taxes or charges (“strategic bias”) and/or the word “tax” setting off in principle objections (“protest votes.”) Although some academics suggest providing the cost of the service to respondents (e.g. public spending per GLAM), other analysts also point to “anchoring” as a form of bias—where respondents latch on to the value provided by the questionnaire.
In order to ameliorate some of these potential biases, respondents were provided with brief information about the contribution GLAMs make to society. They were then asked if they would be willing to make a donation to support GLAMs across the country in the event that public funding was withdrawn. A short form of the WTP question is below. (The full question is included in the questionnaire, located in Appendix 6)
In one way or another, all Canadians currently pay towards the annual upkeep and development of galleries, libraries, archives and museums ( GLAMs) whether through taxes, donations, entry fees or other means. However, imagine that GLAMs had no other sources of government or private funding and the only way of maintaining them was to rely on individual donations. In such a situation, what is the maximum amount you would be willing to pay each year as a donation to maintain all of Canada’s non-profit GLAMs?
Respondents were then asked to consider how much they would be willing to pay given various price options, but they could also freely select a value of their own if they wished to.Footnote 66
Respondents were reminded of the fact that they had limited budget to pay for GLAMs in addition to their everyday spending. In addition, the online survey allowed respondents to see how their WTP for each institution added up to a total for all GLAMs as another counter to overestimating WTP. All 2,045 respondents were required to provide values for this section of the survey.
Source: Oxford Economics
Figure description
As indicated in Fig. 12 above, current users tended to have higher valuations than non-users. This is in line with expectations and would reflect the fact that such respondents may be mixing their use values with broader non-use values held across society.
It is the value reported by non-users that is of primary interest for this study. This can be taken as the underlying non-use value for GLAMs held by society as a whole (i.e. users and non-users alike). Multiplying the respective non-use values per respondent by the estimated total number of Canadian residents aged 16 and older on July 1, 2018 (31.1 million) allows for an assessed non-use value for each institution, as well as for the GLAM sector as a whole.Footnote 68 These values are reported below. They reflect one assessment of how much society is willing to pay to preserve GLAMs, above and beyond the values placed in their everyday usage.
Of course, some would argue that even when non-use value is added to the other values discussed in this report, it still does not capture all the social value to be found in GLAMs. The chapter on Multi-Criteria Analysis ( MCA) provides a qualitative indication of the broader value of GLAMs.
| Item | Galleries | Libraries | Archives | Museums | Total |
|---|---|---|---|---|---|
| Average non-use value per person $(1) | 17.2 | 17.3 | 14.3 | 22.3 | 71.1 |
| Canadian population, 16 and over as at 1 July 2018 (million) (2) | 31.1 | 31.1 | 31.1 | 31.1 | 31.1 |
| Non-use value $(million) (3) = (1) * (2) | 536 | 537 | 446 | 693 | 2,212 |
Source: Oxford Economics
All figures subject to rounding
After reporting their valuation of GLAMs, respondents were asked to justify their response. The figure below shows the average willingness to pay of non-users according to the reasons given for their valuation.Footnote 69 Very few non-users (74) said they did not value GLAMs, while most non-users stated they valued GLAMs highly and/or were happy to fund GLAMs. Some non-users (210) who reported having never used GLAMs (or being unlikely to use one) still reported a willingness to pay of $60 to maintain their operations. Lastly, the largest group of non-users reported being unable to afford to fund GLAMs (247 respondents) and hence reported a lower willingness to pay ($34 for all GLAMs).
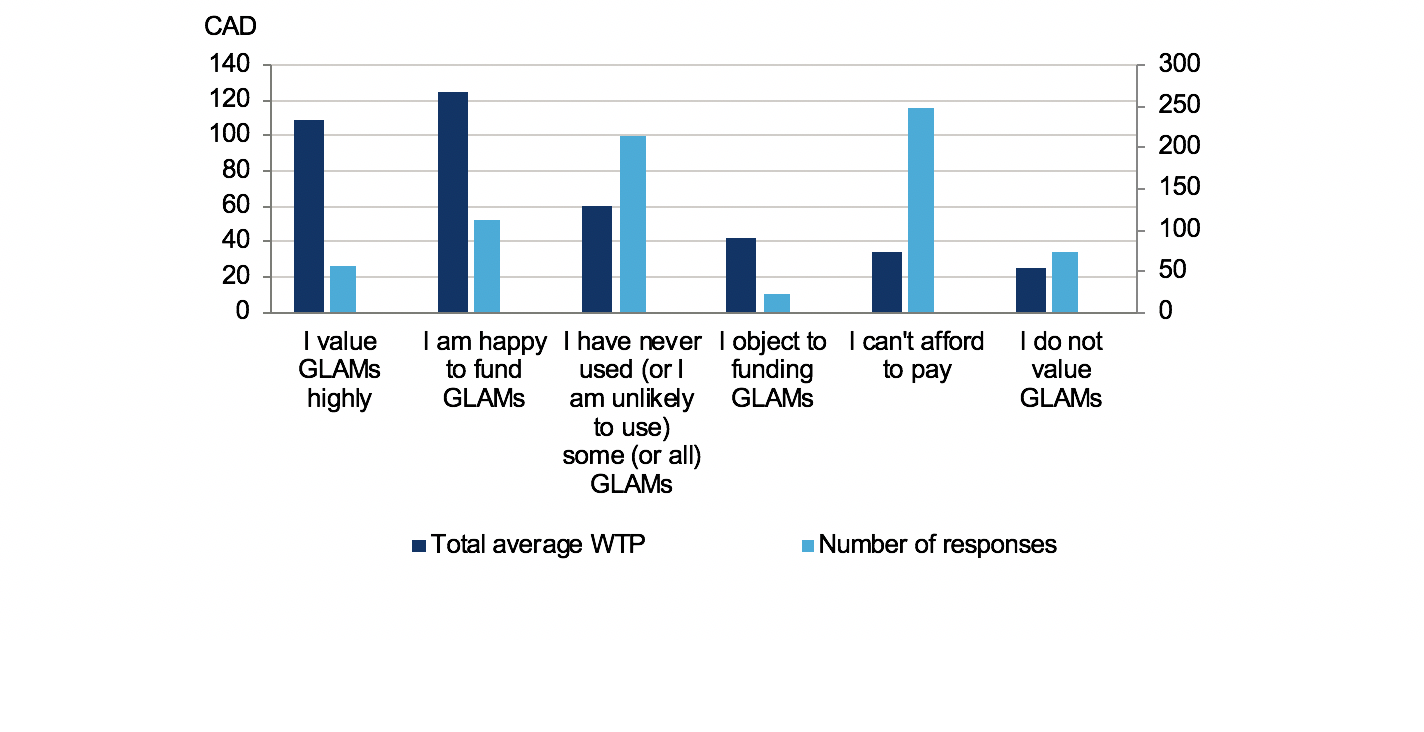
Source: Oxford Economics
Figure description
Online value
6.1 Background
Just like physical visits, people can connect using GLAMs online portals either through “traditional” websites and catalogues, or increasingly via social media portals.Footnote 70 And just like physical visits, online visits are one way users directly interact with GLAMs. So, they constitute another form of consumer surplus that needs to be taken into account in valuating GLAMs.
GLAMs websites and social media portals are becoming an increasingly important resource for users. The functions of these online channels include providing information about the facility itself and about upcoming events, offering interactive shows and educational initiatives, research in online catalogues and placing holds and requests for materials, access to various e-resources as well as to digitalised documents and images, downloading or streaming content, as well as a direct exchange with users through social media.
GLAMs’ online services therefore provide a way for the public to “virtually connect” with such facilities without necessarily visiting them. To the extent that people give up their free time to access online GLAMs’ data rather than doing other things, they are implicitly valuing the online services provided by these institutions.
Economists have only recently turned their attention to methods to assess the value of online activity. One way forward in understanding such value is to adapt existing literature on the value of the Internet to the range of online services offered by GLAMs. This approach is described briefly below and in more detail in Appendix 3.
6.2 Estimating online value
The key to understanding the value of online services is to see them as a form of information, with the cost of accessing such information mainly being expressed in terms of time. And, the more time required to obtain a given piece of online information, the less people are likely to use it.
For example, consider if all GLAMs online users had to revert to dial-up rather than broadband to access GLAMs’ online services. The increased hassle and slower speeds of a dial-up connection would likely deter many users, so demand would fall (and consumer surplus would be lowered). Conversely, the introduction of online services and fast broadband has seen much greater access to GLAMs information in recent years because it has become much quicker and easier to access data.
The figure below indicates this. While the numbers are hypothetical, imagine users were still restricted to dial-up connections to access GLAMs data and the cost in time taken was equal to $20. In the example, only 10 people use the connection. However, with a broadband connection, things are obviously much quicker—the time cost falls to $5 and so 30 people use GLAMs’ online resources. These facts also give us a clue about how much people value access to the data and how sensitive they are to time costs (i.e. their “elasticity.”) The 20 extra people who use GLAMs online services at $5 must value this data at less than $20. Why? Because otherwise they would be spending this much to access the data in the first place.
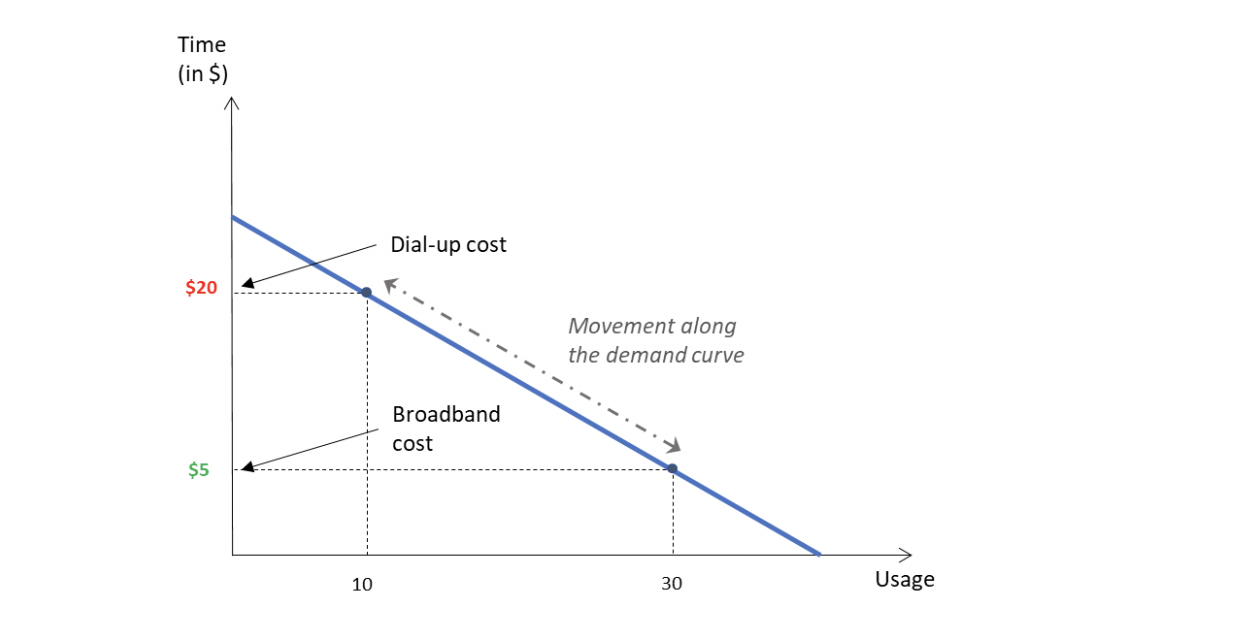
Figure description
The high online usage of certain GLAMs, such as archives, relative to their physical usage also provides an indication of these preferences.Footnote 71 The speed and convenience of the Internet means that many more archival inquiries are made than would be the case if all such users had to physically access the data. If the online services did not exist, then many current online users would face higher (physical) access costs and, like our dial-up example above, many could be deterred.
So, essentially the more time taken to obtain a piece of information (i.e. the higher the cost), the lower the demand for it and vice versa.
These facts give us clues about how to value online services. The time users spend online accessing GLAMs content indicates how much time they give up to do so (i.e. their online access cost). With some information about how sensitive people are to changes in such costs (i.e. elasticities), we can then estimate a demand curve for GLAMs online content and consumer surplus in a way that is analogous to the estimation of consumer surplus for physical access using TCMs.Footnote 72
Accordingly, our national survey asked respondents to nominate time spent and frequency of use of GLAMs website, catalogues and social media portals. This was supplemented by data on time spent online reported by various GLAMs across the country. This allowed us to develop a view on the amount of time spent per session for various GLAMs across official websites, catalogues and social media portals.
The estimated median amount of time spent on websites, catalogues and social media was combined with Canadian values of time (also employed in the TCMs) to give the time cost of online usage per session.Footnote 73 Using information on the number of sessions (using Canadian Heritage and CULC data), and sensitivity to the cost of time online, we estimated a demand curve and consumer surplus for the online usage of various GLAMs. Fig. 16 indicates how this was done for museums’ websites. The same approach was used for other GLAMs and for social media.
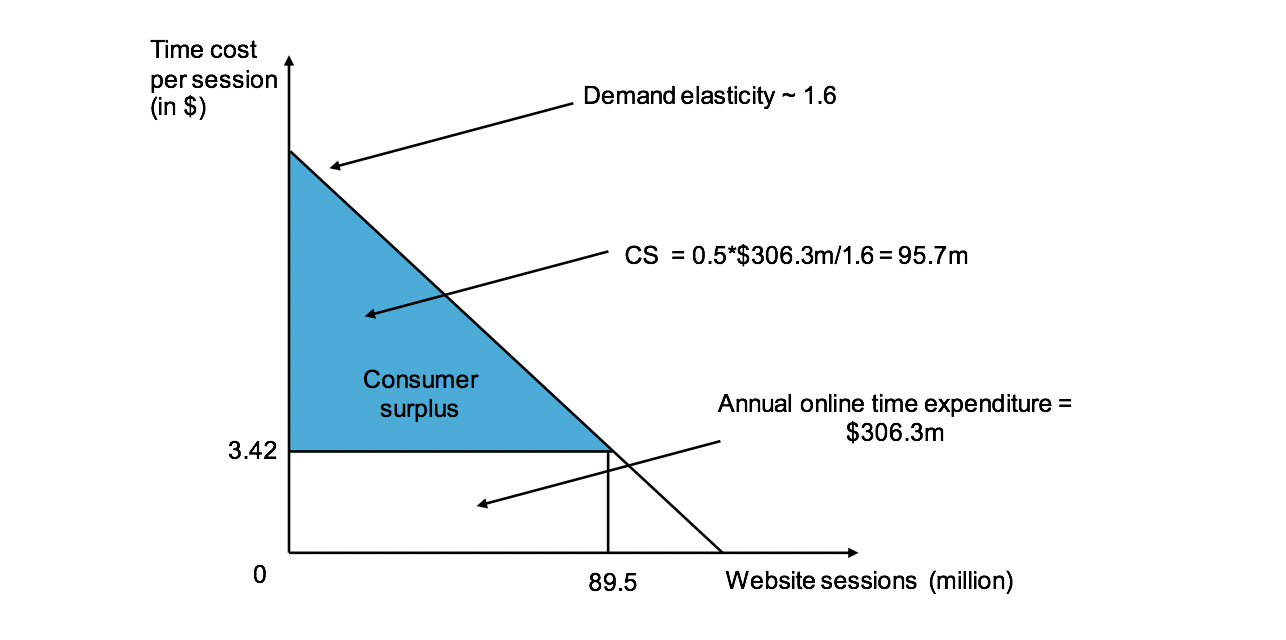
Figure description
Appendix 3 provides more details on the approach adopted to measure the value of GLAMs online services.
However, the national survey and supplementary material from GLAMs provide more than just data about dollar values. One of the issues uncovered in the data exploration phase of this report is that there is a lack of information about the usage of social media in GLAMs in general. Given the rising importance of social media this is an important issue.
The survey data suggests that websites remain the single most commonly used online tool to access GLAMs. However, analysis of such data also suggests that social media make a relatively large contribution to total usage and that the frequency of use of some forms of social media is higher than that of websites.
These facts suggest that social media could be an important avenue through which people access GLAMs (though to date the extent of this has not been comprehensively quantified).
6.3 Online value
Estimates for GLAMs online value (i.e. consumer surplus) are indicated in the figure below. As indicated, these results include official websites, catalogues and Facebook, Twitter and Instagram usage but exclude other social media portals due to concerns over small sample sizes.
| Item | Galleries | Libraries | Archives | Museums | Total |
|---|---|---|---|---|---|
| Website and catalogue value ($million) (1) | 68 | 367 | 114 | 120 | 668 |
| Social media value ($million) (2) | 310 | 269 | 240 | 157 | 975 |
| Total online value ($Million) (3) = (1) +(2) | 378 | 636 | 353 | 277 | 1,644 |
Source: Oxford Economics
All figures subject to rounding
Formal education
In addition to their offerings for adult visitors, GLAMs generate significant educational benefits to school students who undertake visits as part of formal school or educational programs.
This chapter draws on evidence from the academic literature on the long-term returns to school education in order to estimate the value of GLAMs’ educational contribution to students and society as a whole.
School student visits to GLAMs are an important part of the educational process. Schooling provides a formal framework in which learning can occur and, as indicated below, the benefits of such education are well documented. Accordingly, it would be expected that school visits to GLAMs as a part of an educational curriculum would form a part of these benefits. At the same time, visiting GLAMs can serve to inspire creativity, ideas and learning, all of which may be of long-term benefit to students as part of their formal education. Indeed, there are some scholars who argue that the learning experience offered by school field trips to GLAMs (or related cultural institutions) can offer particularly effective learning environments. For example, a school trip to a museum need not directly inspire someone to become a scientist or artist. The long-term value of the trip can often lie in the way in which structured visits to GLAMs can encourage a mindset which is more innovative and promote critical thinking—and this can be reflected in the value of the jobs which people ultimately get.
Quantifying the value of school student visits to GLAMs may seem a difficult issue to come to grips with. However, over the long term, formal education, whether it consists of student visits to GLAMs, or more typical day-to-day school learning, produces a more knowledgeable and productive workforce. This productivity benefit, in turn, will be reflected in the future wages of workers. Economists have long recognized this, which is why a key component of the value of school or post-school education is often measured as the value that they contribute to future wages. Likewise, to the extent that formal educational visits to GLAMs contribute to this long-term acquisition of knowledge and skills base, their value should be embedded in such wages.Footnote 74
In addition, there may be other long-term non-wage effects of education, such as the effects of better civic values, trust, reduced criminality and commitment to democratic institutions—often referred to as “social capital.” A discussion of such wider benefits is provided in a later chapter of this report.Footnote 75
Also note that the educational values measured here occur over the longer term (as opposed to the immediate value of trips measured by the TCM). This reflects the long-term nature of the educational process—its benefits may only be revealed across a person’s lifetime, well after the initial education. Some of the benefits may also flow to “third parties,” such as the government which benefits from higher future wages through higher tax revenue. These third-party benefits are referred to as “externalities” by economists.
The international evidence on the benefits of school education over the long-term is especially strong and consistent. In particular, the Canadian work of Oreopoulos using changes in compulsory education regulations across provinces provides powerful evidence of the returns to school education in Canada. This work suggests that the value of a year of school education is equivalent to a long-term wage uplift of 11.7% per year over an average person’s working lifetime.Footnote 76
This work is also highly consistent with other international studies of the returns to school education.Footnote 77 Knowing the returns to school education therefore allows us to measure the value of formal educational visits to GLAMs.
The box below indicates how the quantification of the value of educational visits was carried out. In essence the number of student visits to GLAMs was used along with the lifetime value of each visit (as measured by the wage uplift). This allowed an estimation of the value of formal education visits to GLAMs over a person’s lifetime.
Determining the Value of Formal Education Visits to GLAMs
Estimation of the value of formal educational visits was based on a variety of sources. Canadian Heritage’s Survey of Heritage Institutions: 2017 indicates the numbers of school group visitors to galleries, archives and museums in 2015, along with the defined size of school groups.
In the case of libraries, CULC figures report educational figures including school educational programs, so this was used as an indicator of formal educational instruction sessions.Footnote 78 These were then grossed up to allow for non- CULC public libraries using the adjustment factor of 1.25, described above.
These data were supplemented by information on school visits provided by a number of GLAMs across the country. These institutions indicated that visits could typically last 1-2 hours. However, as it is likely that the visit time itself was complemented by pre and post educational instruction in a school setting, so an average time of one day’s instruction was assumed.
Oreopoulos suggests the annual rate of return in future wages from a year of school education (comparing those who completed high school to those who did not) is 11.7% in Canada.Footnote 79 That is, an extra year of education adds 11.7% to a person’s earnings during each year of their working life. The lifetime income of a Canadian, who did not complete high school, was then estimated over the ages 20 to 65 on a present value (PV) basis using a 3.5% real discount rate.Footnote 80
We estimate an average lifetime income of $536,000 in present value (PV) terms for Canadians who did not complete high school.Footnote 81 Given an 11.7% uplift, the lifetime value of doing an extra year’s school is therefore estimated as approximately $63,000.
Based on a school year of 196 days this implies that the average PV of a school visit to GLAMs is $320 per student (63,000/196).Footnote 82 Multiplying this across the annual number of school students visiting GLAMs (estimated at 9.7 million from the data above) suggests the PV of educational benefits of GLAMs is some $3.1 billion per annum. (Note that these effects do not include any non-wage (social capital) benefits from GLAMs or the additional learning benefits that may accrue from field trips above and beyond a typical day at school.)
The value of formal educational benefits for Canadian GLAMs can be calculated using the values derived by the calculations in the box above. This process yields a total value of $3.1 billion. Values for individual GLAMs are also indicated in the table below.
| Item | Galleries | Libraries | Archives | Museums | Total |
|---|---|---|---|---|---|
| Number of school children visits or educational sessions per annum (million) (1) | 1.36 | 4.26 | 0.13 | 3.97 | 9.72 |
| Lifetime PV per visit $(2) | 320 | 320 | 320 | 320 | 320 |
| Value of formal educational benefits $(million) (3) = (1) * (2) | 435 | 1,361 | 41 | 1,271 | 3,108 |
Source: Oxford Economics
All figures subject to rounding
Wider benefits
8.1 Background
Standard economic principles assume that people using GLAMs have perfect information—that is, they are fully aware of all of the benefits of their usage and make their decisions to use them accordingly. This allows for powerful insights into people’s behaviour (or “revealed preferences”) through techniques such as the travel cost models ( TCM), discussed above.
To recap: the demand curves and consumer surplus developed through the TCM are one way of indicating the value that people place on GLAMs usage, taking into account usage costs and alternatives. If it cost more to use GLAMs, some people may stop using them, as the costs would exceed their perceived benefits (and consumer surplus would fall). If it cost less to use GLAMs, more people would use them and/or people may use them more often.
However, economists (and in particular the burgeoning field of behavioural economics) recognize that information may be imperfect. People may use GLAMs with only partial knowledge of the benefits they bring to themselves and/or others in the community. There may be wider benefits (“externalities”) to society which may not be captured by a user’s consumer surplus as measured using TCM or other direct valuation approaches.Footnote 83 Some of these wider benefits have already been addressed in the preceding chapter on formal educational benefits. However, there may be others beyond these, which may be more difficult to incorporate into a CBA for a variety of technical and methodological reasons, but which are important to recognize.
This chapter discusses these wider economic benefits of GLAMs. These do not form part of the assessed CBA for reasons explained below (and in Appendix 4). In addition, there is an argument that economic frameworks cannot (and should not) attempt to quantify all aspects of GLAMs impacts—and indeed it is for this reason that broader qualitative measures are also used to measure such benefits. These measures are discussed in the following chapter on MCA.
A number of wider benefits are sometimes noted in the context of GLAMs. Some of these include:
- Wellbeing effects
- Social capital
- Informal education effects (of children and adults)
- Long term economic “spillover” effects
In considering these effects, it is important to balance considerations about the additional value GLAMs may have above and beyond conventional measures, while recognizing the power and rigour of an economic welfare approach (and the structure it requires).
It should also be noted that many of the concepts below have some degree of overlap, meaning they could not necessarily simply be “added up” even if they were amenable to full quantification. Fig. 19 indicates some of the key concepts discussed below and the ways in which they may overlap.
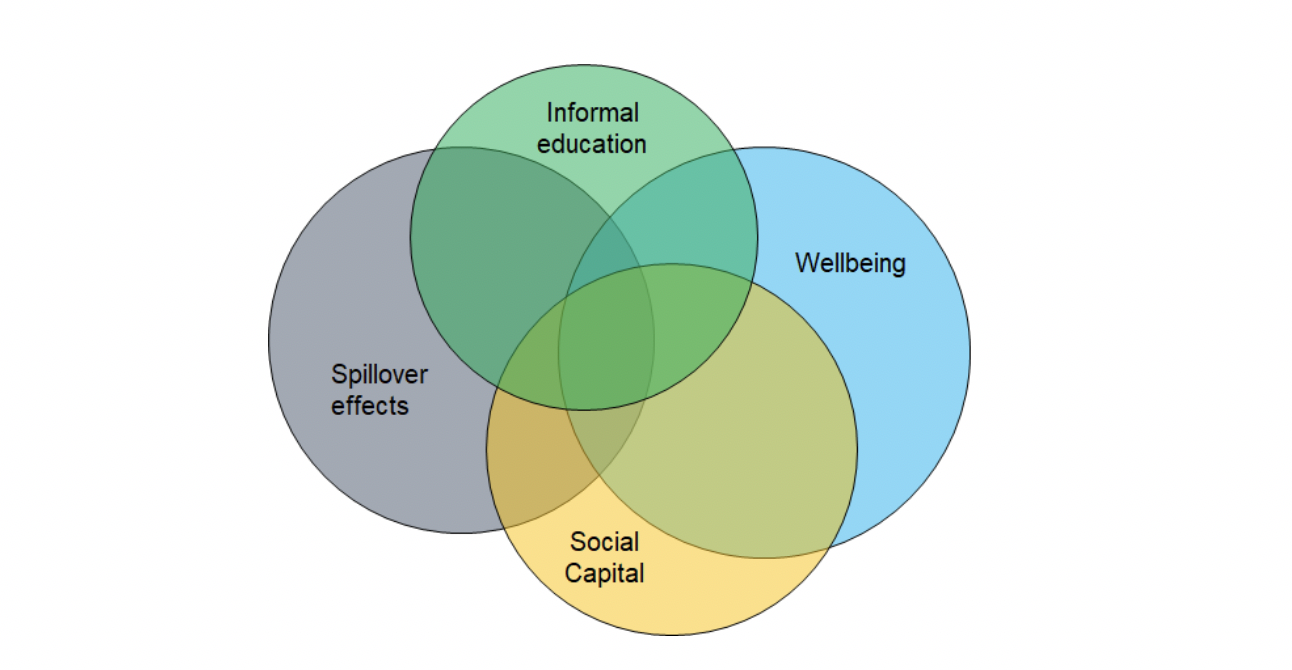
Figure description
8.2 Wellbeing effects
GLAMs can be sources of reflection and inspiration for creativity to their visitors. In principle, all GLAMs share these attributes. Many who have visited a gallery can attest to the sense of peace, reflection and inspiration such institutions can create. They can also help us find fulfilment by generating creative insights. Museums can help us understand our place in the world—or the cosmos—and cause us to reflect on our own purpose and contribution to society. They can inspire us with the struggles of past generations—and spur on our hopes for the future. And they can help us understand the struggles and hopes of cultures other than our own.
Libraries—particularly in their growing role as a civic hub—can also be an important source of personal wellbeing. Apart from the opportunity for deep thinking, learning and reflection, they also allow for interaction, the exchange of ideas and bonding, all of which can contribute to a sense of meaning and community. And while it may seem less obvious, the same effects could be discerned for archives, where research can also allow users to uncover new ideas and find fulfilment through deep research and learning.
In doing all of this, GLAMs can enhance our sense of overall wellbeing. A greater appreciation of the wider world could also help us understand our points of view and cultures, potentially helping us reach out to others in our neighbourhood and/or increase our likelihood to volunteer within our community. The figure below summarizes these virtuous pathways, showing how GLAMs help to mutually enforce the different aspects of wellbeing and social cohesion.
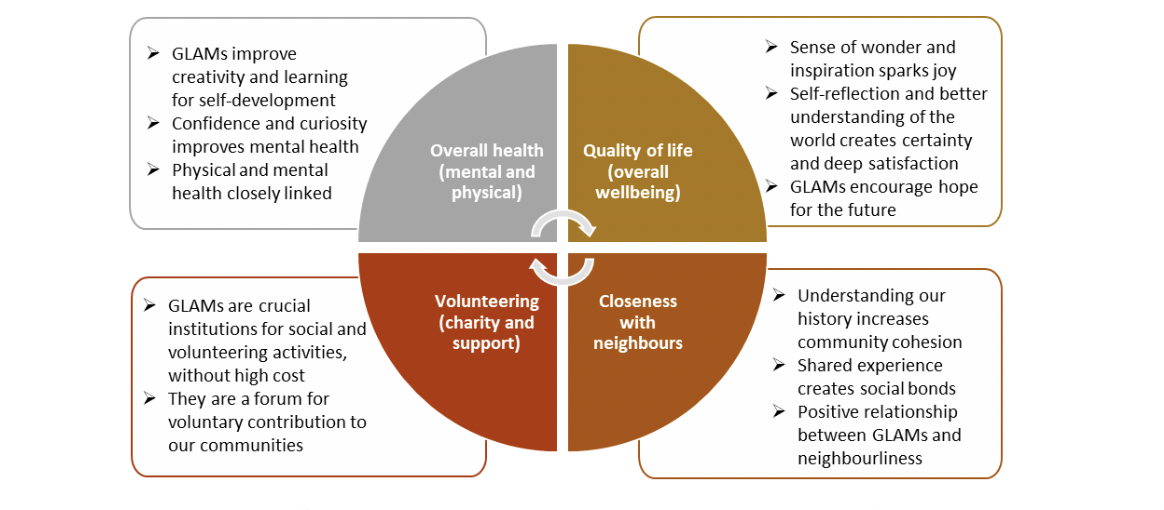
Figure description
The wellbeing effects associated with GLAMs have been the subject of much discussion, study and debate in recent years. The research on wellbeing effects has gradually become more compelling as evidence has accumulated.Footnote 84 Indeed, Canada has become a world leader in recognizing the wellbeing effects of GLAMs. Extensive cooperative research work between the Montreal Museum of Fine Arts and the medical profession has resulted in a recognition of wellbeing effects, with doctors now being enabled to write prescriptions for visits to GLAMs.Footnote 85
Are such wellbeing effects quantifiable through an economic framework? One line of argument is that this is indeed precisely one of the reasons why people visit GLAMs in the first place. If that is the case, then one argument would be that the wellbeing effects are fully incorporated into people’s decision-making to visit and therefore into the measures of consumer surplus estimated above.
However, an alternative is that these effects are not incorporated into people’s decision-making (or are only partly so). People may not (fully) realize how a visit to GLAMs may be therapeutic in some sense, increase their awareness of the world or indeed make them a better citizen.
As it is uncertain whether people take (or fully take) such effects into account in their visits to GLAMs, analysts such as Fujiwara suggest an alternative approach (wellbeing valuation or “WV,”) which focusses on measuring the wellbeing people obtain from GLAMs.Footnote 86 This is seen as an alternative to the traditional methods such as TCM or contingent valuation.
Work done by such analysts is, to date, in its relatively early stages. Moreover, as it relies on complex “top down” economic modelling, and assumptions about relationships, there are inevitably questions relating to causality. For example, it may be that those visiting GLAMs are more “neighbourly” than those who do not—but is this because GLAMs inspire such people to “chat across the fence” or because “more neighbourly” people lead active and diverse lives and choose to visit GLAMs? Moreover, much of the estimation involved can vary depending on the modelling specifications and assumptions involved.
Accordingly, this approach has not been undertaken as the main basis of this study. Nonetheless, it is important to recognize wellbeing as a potential wider benefit and worth investigating potential relationships between GLAMs usage and wellbeing measures more closely.
Extensive work relating museums, galleries and libraries to various life satisfaction measures has been done by Fujiwara et al. in the UK using a variety of self-reported wellbeing measures (e.g. subjective wellbeing, health, happiness). This approach looks at how using these institutions impacts people’s self-reported measures of wellbeing. It also offers a method for converting these impacts into equivalents in monetary terms. In a series of papers these authors find that:
- Visiting museums is associated with an improvement in wellbeing (happiness) equivalent to receiving £3,228 ($6,874) per year.Footnote 87
- Frequent library use was associated with an improvement in wellbeing equivalent to receiving £1,359 ($2,894) per year.Footnote 88
- Library usage could improve the prospects of young people advancing to higher education, with an estimated benefit of £2,114 ($4,955) per person.Footnote 89
The values cited in the first two dot points above represent the amount of money that would generate the same effect on a person’s wellbeing as using the institution. In other words, visiting museums, for example, has the same wellbeing impact as receiving $6,874 per year. The value for library usage cited in the final dot point represents the net benefit per person associated with libraries increasing the likelihood of higher education attendance (which in turn increases future earning power as detailed in the discussion of formal education above).
These authors note that this work should be subject to caveats about causality. In essence, best efforts were made to control for the effects of demographic variables (e.g. age, education, income) and in some cases “instrumentation” to deal with causality, but reverse causality could still be an issue. Nonetheless they argue that the approach adopted would be acceptable for public policymaking.
Nonetheless, such work raises interesting questions, namely: do similar effects show up in the case of Canadian GLAMs? The box below provides an outline of how the current study went about this task. More technical detail is provided in Appendix 4.
Measuring wellbeing
In order to explore this question, the national survey undertaken for this study included questions relating to several dimensions of wellbeing, based on past Canadian social surveys.Footnote 90 The detailed questionnaire is included in Appendix 6 but, in brief, questions from the survey selected for further analysis include those relating to:
- Life satisfaction—How satisfied a person was with their life
- Health—How a person rated their health
- Neighbourliness—Whether a person knew most or none of their neighbours
- Volunteering—Whether a person had volunteered or not in the last 12 months.Footnote 91
Consistent with the work cited above, participants were asked to assess their wellbeing for life satisfaction, health, neighbourliness as well as whether or not they had been volunteers in the past year. These were then coded on the numerical scales indicated above.
Given that GLAMs attendance (and the frequency of such attendance) are also known from the national survey, this allows for analysis of the impact of GLAMs usage on measures of wellbeing.
The most straightforward way of doing this is to compare the average ratings of respondents who had used at least one GLAM in the past year with those who had not.
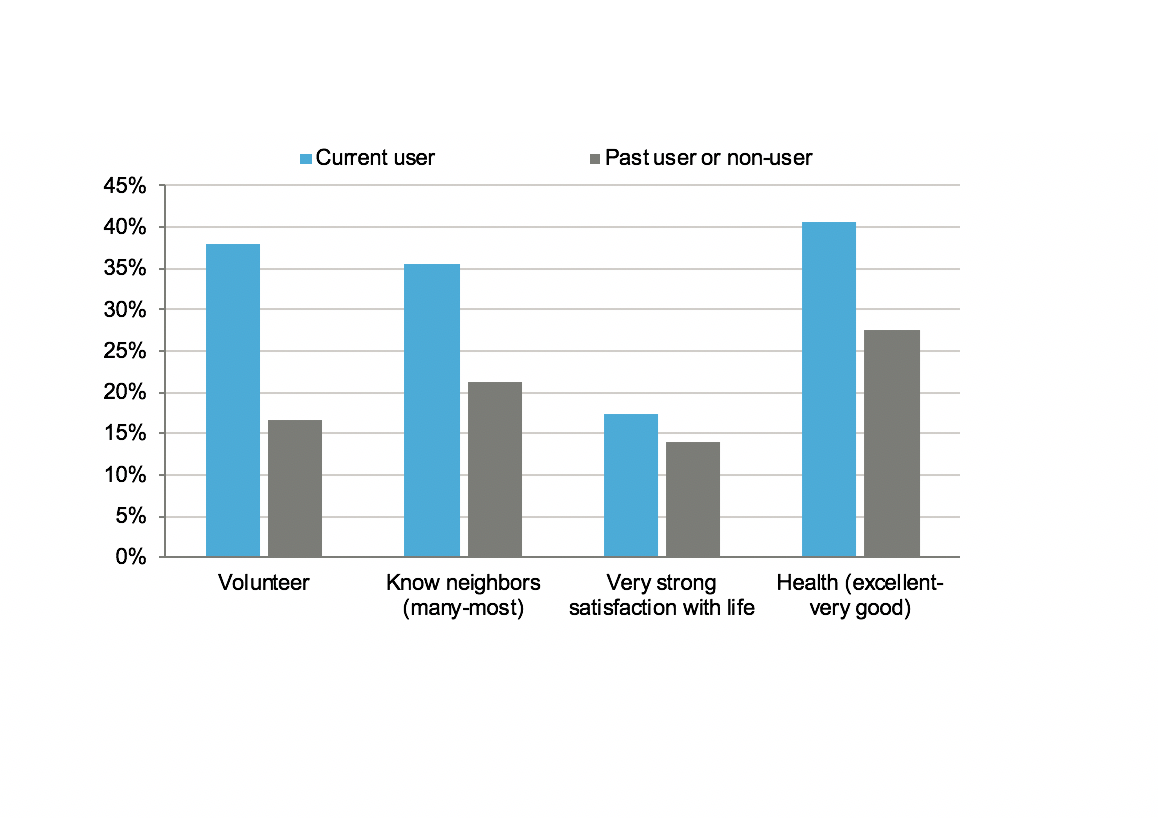
Source: Oxford Economics
Figure description
Of course, many other influences such as age, education, employment status and gender could have an influence on people’s wellbeing. Accordingly, more detailed econometric work was undertaken, controlling for the influences of income, age, education, employment and gender. In addition, the frequency with which users visited GLAMs could make a difference. If so, an approach examining just the subgroup of high frequency users could have different results to a model which looks at overall average usage. Two basic model specifications were therefore used for this analysis:
- Approach 1—the relationship between those who used GLAMs during the past year and wellbeing (the usage approach); and
- Approach 2—the relationship between frequent (3 or more times) GLAMs users and wellbeing measures (the frequency approach).
Both of these approaches used regression analysis to control for age, income, employment status and gender so as to unpick the impact GLAMs usage might have on wellbeing.
These approaches and more detailed results are described in more detail in Appendix 4.
The key modelling results for the approach relating wellbeing to usage of GLAMs over the past year (Approach 1 in the box above) are indicated below. The dependent variable represents the wellbeing indicator.
| Dependent Variable | Impact of using at least one GLAM in the past year (coefficient size) | Scale Footnote 94 |
|---|---|---|
| Life satisfaction | Not significant | - |
| Health | 0.14 | 1-5 |
| Neighbourliness | 0.07 | 1-4 |
| Volunteering | 0.16 | 0-1 |
Source: Oxford Economics analysis
In straightforward terms these results indicate positive and significant relationships between GLAMs usage and wellbeing indicators for health, neighbourliness and volunteering. For example, usage of at least one GLAM in the past year is associated with a 0.14 increase in self-reported health status (on a scale of 1-5, where 1 is poor and 5 is excellent). Positive correlations were also recorded between GLAMs usage and neighbourliness and volunteering.
Interestingly enough, no significant relationship was found between GLAMs attendance and life satisfaction. This is in contrast to the findings of Fujiwara et al. (April 2014) for UK libraries. However, life satisfaction can be distinguished from “happiness” measures which are sometimes used in wellbeing surveys. Life satisfaction represents people’s evaluation of life overall (and how it may measure up to their goals). Happiness taps into people’s emotions and moods at the moment. Fujiwara (2014) makes the point that since these measures tap into different aspects of people’s life, we might expect them to produce different results when measuring the impacts of GLAMs. Moreover, he also notes that health is highly correlated with happiness measures and may shed light on how GLAMs usage impacts wellbeing.
Although the current study contains no happiness measure, these observations are instructive. Aside from being of interest in its own right, health may therefore be something of a “masking variable” (or proxy) for happiness. With this in mind, and with recent Canadian initiatives recognizing the potential impact of GLAMs on health, the results for health impacts are of particular interest.
These approaches and more detailed results are described in more detail in Appendix 4. Also, as indicated in Appendix 4, these regression results also make it possible to provide monetary estimates of the equivalent benefit in terms of wellbeing conferred by GLAMs usage. These estimates suggest that the annual value to average GLAMs users is equivalent to $1,440 in improved wellbeing (as measured through health effects).Footnote 95
An alternative approach (Approach 2, or the frequency approach) is to look only at more dedicated GLAMs users (i.e. those who used GLAMs three times or more during a year). This was modelled using a variety of specifications: simple linear regression, logistic regression (“logit”), instrumental variable model with two-stage least squares (2SLS) estimator, and the ordinal logit model.
Generally, we started with simpler models (the simple linear regression model) with more variables (including cross products between variables), then gradually reduced the number of variables to only those that were significant and without any statistical issues.
Appendix 4 provides details regarding the methodology used and the full results of the regressions that performed best. These results cover each of the wider benefits of overall subjective wellbeing, health, community engagement and volunteering. Each benefit is broken down by venue type: galleries, libraries, archives and museums.
To compare different models, we used a range of criteria:
- Whether the independent variables are statistically significant at a 95% confidence level (i.e. their parameters have a p-value smaller than 0.05);
- Size of the visitation frequency coefficient (where a larger positive coefficient shows a greater impact on the wellbeing aspect of interest); and
- Overall model fit (adjusted R-square or Chi-square statistic).
Fig. 23 below shows the coefficients for visitation frequency (often referred to as “impact factors”) across these different model specifications.
| Broader benefit type | Coefficient (standard error, frequency variable type) | |||
|---|---|---|---|---|
| Simple linear regression | Logistic regression | Instrumental variable (2SLS) | Ordered logit regression | |
| Overall subjective wellbeing | 0.016*** (0.004) [Cont.] |
0.276*** (0.029) [Cont.] |
0.165* (0.095) |
|
| Galleries | 0.717*** (0.183) |
|||
| Libraries | 0.667*** (0.093) |
|||
| Archives | 0.880*** (0.267) |
|||
| Museums | 0.686*** (0.100) |
|||
| Health | 0.083* (0.044) |
0.419*** (0.152) |
0.276*** (0.094) |
|
| Galleries | 0.062*** (0.031) |
0.426* (0.237) |
0.603*** (0.174) |
|
| Libraries | 0.062*** (0.020) |
0.375*** (0.124) |
0.358*** (0.094) |
|
| Archives | 0.104*** (0.044) |
0.484* (0.251) |
||
| Museums | 0.047*** (0.020) |
0.232*** (0.114) |
||
| Neighbourliness | 0.255*** (0.065) |
1.055*** (0.281) |
0.510*** (0.118) |
0.523*** (0.104) |
| Galleries | 0.224*** (0.042) |
0.944*** (0.174) |
0.758*** (0.168) |
|
| Libraries | 0.167* (0.098) |
|||
| Archives | 0.300*** (0.065) |
1.250*** (0.276) |
1.017*** (0.250) |
|
| Museums | 0.089*** (0.022) |
0.341*** (0.107) |
0.374*** (0.100) |
|
| Volunteering | 0.247*** (0.065) |
0.983*** (0.282) |
0.308*** (0.069) |
|
| Galleries | 1.195*** (0.182) |
|||
| Libraries | 0.562*** (0.108) |
|||
| Archives | 0.983*** (0.282) |
|||
| Museums | 0.636*** (0.109) |
|||
Source: Oxford Economics
Significance: *** = 0.01, ** = 0.05. * = 0.1. Standard errors are robust. Superior results are bolded.
Models with insignificant frequency parameters are excluded. [Cont.] = continuous dependent variable.
This more involved approach evidently reveals positive correlations between GLAMs visitation and core dimensions of wellbeing, controlling for demographic factors. Note that, of the simple linear regression models, only the overall subjective wellbeing for all GLAMs has a dependent variable that is effectively continuous (measured on a 0-10 ordered scale), as does the 2SLS instrumental variable model. This means that each of the impact factors, or coefficients, represents the increase in wellbeing resulting from additional visits. The other simple linear regressions regress binary or dummy variables (1 for frequent users, otherwise 0) on a mixture of continuous and binary regressors (the dependent variables).
Different combinations of variable formats mean that most of the regressions used must be interpreted carefully. For instance, what does it mean to fit a line when the result can take only either 1 or 0? Such a regression function is interpreted as a conditional probability. For instance, we estimate that there is a 0.72 probability that regular gallery visitors (three or more visits) report higher overall subjective wellbeing than non-regular visitors, controlling for demographic variables (Stock & Watson, 2015). Notably, all regressions control for only those demographic factors that are statistically significant to avoid bias and inflation in the results.
At a glance, robust regression models signal that GLAMs visitation has a significant positive influence on wellbeing. We see stronger impacts of visitation frequency on different aspects of wellbeing for individual GLAM types. This is an intuitive result since we might expect that the same groups of people who visit certain venues also share greater similarities in their self-reported wellbeing and demographic factors. In order to compare these wider benefits across wellbeing dimensions or individual GLAMs venues, a more detailed investigation of the regression results is needed, as provided in Appendix 4.
In short, while the relationship between GLAMs and wellbeing may be modelled in a variety of ways (and issues relating to causality persist) these results provide some indicative evidence that GLAMs could contribute to wellbeing.
As is the case for the simpler models examining GLAMs usage vs non-usage above, these benefits may be monetized to the extent that the regression used contains statistically significant parameters, most notably income. For instance, using the 2SLS specification, we find that regular visitation (three times or more annually, across all venue types) is associated with an annual improvement in wellbeing (as measured through health effects) equivalent to $4,149 per GLAMs user. The higher value could be indicative of the fact that more frequent GLAMs usage is associated with improved wellbeing.
8.3 Social capital
There are a variety of definitions of social capital, which circle around the ideas of trust, social cohesion and commitment to institutions. The OECD defines it as “networks together with shared norms, values and understandings that facilitate co-operation within or among groups.”Footnote 96
To a large extent, arguments about social capital would appear to overlap with those about wellbeing discussed above and informal education discussed below. For example, it may be the case that GLAMs visits could enhance understanding of other communities, neighbourliness, volunteering, and result in better educated communities. More education could allow for people to find better jobs (i.e. increased productivity via human capital) and be better citizens.
As is the case with wellbeing and informal education, there have been a large number of studies of social capital, both within Canada and internationally, both as an area of interest in general and in terms of how GLAMs might promote such effects.Footnote 97
However, these impacts may not only be of benefit to the individuals involved. There may be spillover effects such that society as a whole gains—e.g. more people volunteering or being neighbourly could inspire others to do so as well, creating a virtuous circle.
However, to date most arguments relating to social capital have focused on qualitative or descriptive measures rather than trying to measure the phenomenon quantitatively. Apart from the wellbeing analysis in the current study, a partial exception to this is the work of Riddell. However, the social effects would appear to relate mainly to the individuals themselves rather than measuring the follow-on effects (or spillovers) to the rest of society.
The overlap between concepts of social capital and the ideas explored elsewhere in this chapter, combined with the lack of quantification in the literature, make it difficult to quantify such effects.
8.4 Informal education
Apart from the formal educational benefits referred to in Chapter 7, GLAMs may assist with people’s informal education—i.e. education undertaken in people’s own free time. Examples of informal education effects could include improving reading/literacy skills from books borrowed from public libraries and the acquisition of knowledge from attending public museums and galleries.
The suggested link often runs as follows: exposure to GLAMs may help children, in particular, to expand their knowledge. In the case of public libraries, it could help encourage reading, improving their literacy and test scores and thereby improving their chances of entry into higher education and higher paying (and more productive) jobs. In the case of institutions such as museums and galleries, it could help stoke their curiosity, knowledge and creativity and promote after-school learning and better educational results, again increasing the odds of post-secondary education and better wage and employment outcomes. The promotion of STEM learning through museums is often held up as a particular example of such effects.Footnote 98
Many of these effects (particularly those relating to galleries and museums) are referred under the rubric of “cultural capital,” a term originally coined by Pierre Bourdieu to describe familiarity with society’s dominant cultural codes.Footnote 99
Knowing these codes can benefit the individual, even if it is just “signaling” cultural awareness. However, a better educated population may hold potential benefits for learners themselves through higher wages and productivity (the benefit most commonly measured by economists). There may also be effects on broader society as suggested above, since a better educated population may demonstrate better civic values, such as a commitment to the rule of law, lower crime rates, higher participation in voting and other democratic institutions, and increased environmental awareness.
The figure below provides an overview of the positive cycle through which informal education of children and young adults could have these effects for various types of GLAMs.
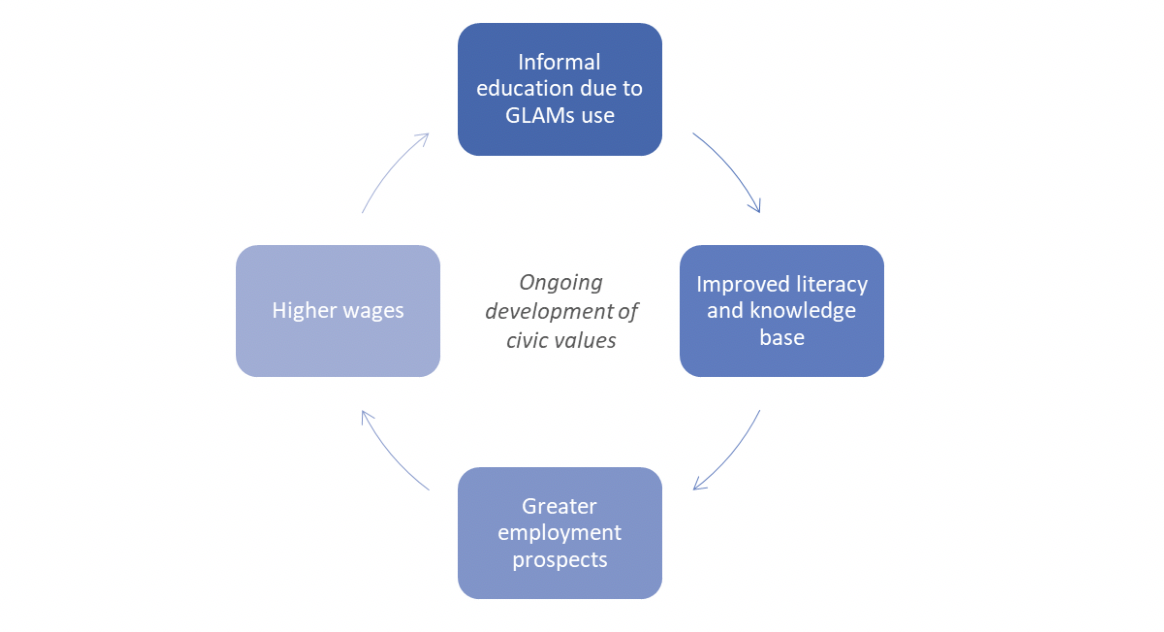
Figure description
These issues are explored in more detail in Appendix 5. In short, there have been promising advances in our understanding of the effects of GLAMs on informal education, and some effects may be quantifiable, particularly in the case of informal learning by children and young adults. We have adopted a relatively cautious stance on this issue and excluded these effects from the CBA for this study. Nonetheless, it is important to highlight the ways in which such effects might impact on economic welfare.
8.5 Long-term economic spillovers
As indicated above, the standard CBA framework adopted above assumes that those using GLAMs do so using a judgement about how valuable GLAMs usage is to them. Consider the example of an entrepreneur who uses a library for work purposes, as part of research for a new business. The TCM should capture the benefits to society of making the trip to the library. If the costs of making the trip were higher than the benefits of the research, the trip would not have been made.Footnote 100
However, economics recognizes (within reason) the potential for what are known as “spillover effects.” These occur when the consequences of personal or corporate actions are not fully appreciated by those involved. A form of (positive) spillover effects, often cited in the economics literature is research and development ( R&D). Firms may invest in R&D for their own purposes and gain some benefit from it. However, the ultimate uses of their innovations are of more use to society than these firms themselves originally intended, because others build upon and adapt their inventions in ways the original inventors never intended.
In principle, there might therefore be a case for GLAMs to exhibit long-run spillover benefits that are not captured in a conventional economic welfare framework in the short-term. Undertaking work-related research in a public library for example could ultimately result in a new product or business. Other businesses might improve on that product in unanticipated ways. Spillover effects may therefore ultimately arise from the usage of the public library to develop the product.
These issues are discussed in more detail in Appendix 5. In short, current economic welfare frameworks have proved remarkably robust to critiques, and issues relating to causality and double counting raise concerns over the application of long-term spillover effects.
Nonetheless, while due caution about such benefits must be exercised, there may be an in principle case for spillover benefits from GLAMs as an addition to conventional economic welfare. In particular, it may be the case that access to GLAMs is an indicator of a society with strong civic values and trustworthy institutions, and one that adheres to democratic principles and the rule of law. The resulting effects could help spur on economic growth over the longer term and provide social benefits.
This is true not only in economic welfare terms, but in still broader social ones as well (a theme taken up in the following chapter). The examples below reinforce this point by considering what happens when access to GLAMs is restricted, more specifically, in the case of archives. Even though archives might be perceived by some as innocuous, they are one of the most socially contentious of all GLAMs. What is kept (and, indeed, what is not) and who can access it can be the subject of great social debate.
Case study: does opening up the archives make a difference?
Underlying many of the questions in this report is the issue of what a world without GLAMs would look like—i.e. what difference do they make? It is not possible to examine such a counterfactual in full (though we point to differences between users and non-users), but it is possible to examine cases where something similar has occurred.
One such example is the partial opening up of the archives of the former Soviet Union (and indeed of its satellite states) after the end of the Cold War. The opening of the archives can be seen as what economists term a “natural experiment”—where events occurring outside the control of analysts provide insights into a particular issue. In this case, a unique event allows us to gain insights which are not limited to the nuances of Soviet history but point to much broader issues concerning the importance of archives in Canada and elsewhere.
While halting and partial, the opening of the Soviet archives has highlighted issues such as:Footnote 101
- Secrecy was so pervasive between different ministries that it was difficult to plan or allocate resources effectively.
- Inefficient ministerial coordination and quality control were major impediments to Soviet civilian technological progress; the military was differentiated by extensive quality control.
- “Storming” (meeting monthly targets in the last few days of the month, resulting in poor quality products) was pervasive and accounting for 40-60% of production by the 1960’s.
- Macroeconomic growth rates were exaggerated by hidden inflation.
- World War 2 deaths were found to be approximately 7 million higher than the figures cited prior to 1991 (27 million rather than 20 million).
- Security rather than ideology was a key driver of the Cold War.
Applebaum (2004) points to released Soviet archival data as being key to her research into the Gulag, helping to quantify the nature of the camps (most inmates were peasants and workers, not intellectuals) and their pervasiveness (with 18 million passing through them). Her point is not that archival research helps us ensure “such things will never reoccur” (or will be identical), but that an understanding of how and why prepares societies to deal with them when they do.Footnote 102
Archival revelations may also be deeply personal; former Stasi archives revealed a pervasive pattern of surveillance which forced families, friends and neighbours to come to terms with difficult issues.Footnote 103 Others have drawn the link between Soviet archival release and international examples, such as South Africa’s post-apartheid Truth and Reconciliation Commission, seeing the opening up of archives as a good indication of government transparency and social robustness.Footnote 104
Western countries are not immune from such issues. In Canada, archives have played a significant role in providing essential documents for the Truth and Reconciliation Commission. The Commission worked from 2008 to 2015 with a mandate to reveal the truth about the individual and collective harms of the residential school system on Indigenous students and their families and inspire a process of healing and reconciliation.
Apart from the fact that ongoing archival research can make countries confront troubling issues in their own history, some have recently faced the somewhat different question of what happens when archival material is destroyed or closed off. Recent examples include the loss of Windrush documents and the cutting off of access to post-1945 Hungarian National Archives.Footnote 105
Is any of this relevant to an economic framework? Should it be? The work cited above indicates how blocking off information impedes our understanding of how economies and societies function. Indeed, the archives suggest that Soviet decision makers themselves suffered from a lack of information about their own society and economy, which impeded their efforts to manage it.
This chimes with the issues explored in the text above. Firstly, restriction of information can tend to mean that key decisions are not made in an efficient way.Footnote 106 Archives are a part of this process—we cannot fully understand the workings of the economy or society if we cannot learn from them, or make optimal decisions. In short, the “burst dam” of Soviet archival material provides a clear indication that archives do make a difference—even in raw economic terms, not to mention broader social concerns.
Secondly, do archives (and GLAMs) have long-run spillover effects? As indicated above, in Canada and most comparable Western countries we would expect that, precisely because access to information is available (unlike the former Soviet Union), much of the ongoing value of archives is revealed in the decision to use them (as measured through methods like the TCM).
Nonetheless, this case study also provides another hint that there may be longer term spillover effects beyond a CBA framework. Seeing what happens when access to data is restricted in extremis allows us to see that archives are an element in creating a society in which confidence about access to information is an element of social capital. They are part of a process upholding a civil society, answerable to an informed and educated citizenry and the rule of law. In principle, some of these spillover effects might be in addition to the direct value obtained by usage and only apparent in the long run at the macroeconomic level (i.e. the “open data” argument).
Beyond this, there are of course the broader social issues, highlighted above, which economic frameworks cannot capture. Restricting access to personal records (whether it be those of the Stasi or the Windrush generation) can have direct effects on living individuals, bringing home the importance of memory institutions to society.
8.6 A note on employment and multiplier effects
Apart from the wider effects noted above, employment and multiplier effects are sometimes noted as important benefits of GLAMs.
As noted, libraries in particular can play an important role in employment and training. For example, a user with a current job may use a public library to find a new one. The library has therefore played some role in finding them a new job. And indeed, the fact that such a job seeker has chosen to use the public library would form a part of their decision to travel to it. Like other reasons for travelling to the library, this would be captured by the TCM estimation. If the benefits offered by library services were lower than the cost of getting to the library, they would not make the trip.
Likewise, those who are unemployed may use library resources to train and find work; the value of the library to these users would be reflected within the TCM.
However, with some exceptions, the new jobs themselves are not part of the benefits measured by economic welfare assessments. This issue is further discussed in Appendix 5.
Multiplier effects on local retailers are also often mentioned in the context of GLAMs. For example, the opening of a new gallery may encourage people to visit and then go shopping in the local area, providing welcome revenue to retailers, who then order from their suppliers and so on ( multiplier effects). However, there are strong technical reasons as to why such impacts are excluded from economic welfare analysis.
In both cases, it is important to distinguish an economic impact study (which measures jobs, GDP and multiplier impacts) from an economic welfare study (which measures the net benefits to society). Economic impact studies measure economic activity in terms of contributions to the economy as a whole, or the share of the “economic pie” accounted for by institutions such as GLAMs. By comparison, economic welfare studies measure how society is better off in terms of net benefits (benefits less costs), i.e. how institutions such as GLAMs grow the “economic pie”.
As noted, the current study is an economic welfare study, so jobs per se and multiplier effects do not form part of the assessed benefits. Conversely many other effects such as consumer surplus, non-use value and formal educational benefits are included in an economic welfare analysis but excluded from an impact study.
A summary of the wider benefits often associated with GLAMs is provided below. This indicates how such effects may (or may not) form part of the wider economic benefits in addition to the economic welfare framework used in this study.
| Effect | Comment on application to economic framework |
|---|---|
| Wellbeing | Wellbeing effects are an important potential effect. However, this approach may be best seen as an alternative valuation approach to the conventional economic welfare framework. |
| Social Capital | Important concept, widely discussed in literature but many aspects overlap with wellbeing, informal education, and spillover effects. |
| Informal Education | Mounting evidence of effects. Nonetheless, there continues to be uncertainty over causal linkages. |
| Spillover effects | There may be some evidence of spillover effects, and “natural experiments” provide some evidence, but a robust quantification dealing with causality remains elusive. |
| Employment effects | Benefits to finding jobs using GLAMs should be captured in the TCM. However, the new jobs themselves would not be part of an economic welfare framework. |
| Multiplier effects | Only appropriate for an economic impact study. Inclusion is inconsistent with principles of economic welfare. |
Source: BIS Oxford Economics analysis
As indicated, further discussion of wider benefits is included in Appendices 4 and 5.
Qualitative social benefits: multi-criteria analysis
As suggested above, economic analysis is an important tool that can shed light on issues such as society’s valuation of GLAMs usage in ways that are insightful, subtle and powerful. However, it is not the only way of looking at the world (nor should be). A good caution to the limits of any world view was offered by one William Shakespeare some centuries ago:
There are more things in heaven and earth, Horatio,
Than are dreamt of in your philosophy.
Hamlet (Act 1, Scene 5)
Some may feel that GLAMs provide more benefits than can be captured by economic analysis—or indeed that they provide intrinsic social values that economic frameworks cannot address. Accordingly, Multi-Criteria Analysis ( MCA) was also used to assess the perceived importance and the degree of effectiveness of these attributes. MCA is used to gain a more holistic view of benefits—e.g. thoughts and feelings about GLAMs. Similar to the welfare approach, the MCA was incorporated into the national survey of the Canadian population, as well as into a survey of GLAMs stakeholders.
Our MCA focused on seven key dimensions that were identified as particularly relevant in discussion with the CMA and LAC. These dimensions are:
- Community engagement and civic participation;
- Preserving cultural and historical heritage;
- Providing access to resources for research, innovation and education;
- Protection of truth, integrity and social values;
- Quality of life, mental and physical health and wellbeing;
- Providing inspiration for creativity; and
- Nurturing of identity for marginalized communities, contributing to community cohesion.
As part of the MCA, we included in our national survey questions about which attributes the general public and GLAMs stakeholders valued the most about GLAMs. Respondents were asked to rate each attribute on a scale of 1-10 to assess their relative importance, thus providing a straightforward indication of the relative value of these criteria to various audiences.
Results tend to show the general public and GLAM stakeholders agree on which social objectives matter the most for each GLAM (Fig. 26). Both groups of respondents agree that archives and museums play a key role in preserving Canadian heritage, while libraries are crucial for providing access to resources for research.
Interestingly, there is less of an agreement on the social objectives of art galleries; heritage preservation is deemed most important to the general public and inspiration for creativity is ranked as number one attribute by GLAMs stakeholders. Another interesting finding relates to perceptions of libraries. Stakeholders see community engagement as the second most important attribute, while the general public ranks it among the least relevant.
As a general rule, stakeholders tend to be more generous in their ratings, with a few exceptions. Galleries’ role in protecting the truth is perceived as more important for the general public than it is for stakeholders. Similarly, archives’ impact on quality of life is felt more strongly among the general public, than among stakeholders.
Although these differences should not be exaggerated, they should be kept in mind; these data offer unique insights about the broader role of GLAMs. They can be used for considerations well beyond the scope of this study and beyond quantitative estimations. For example, they might help GLAMs answer questions like: are GLAMs offering or prioritizing what the public feels is important? Should GLAMs be leading the way, even if the public does not (yet) see some attributes as important as stakeholders do?
Galleries
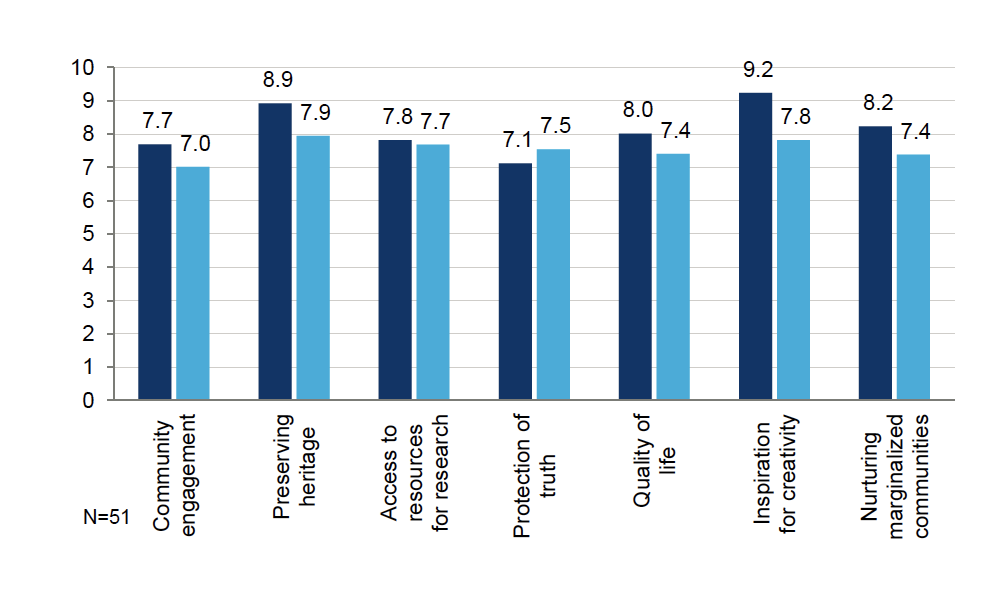
Figure description
Libraries
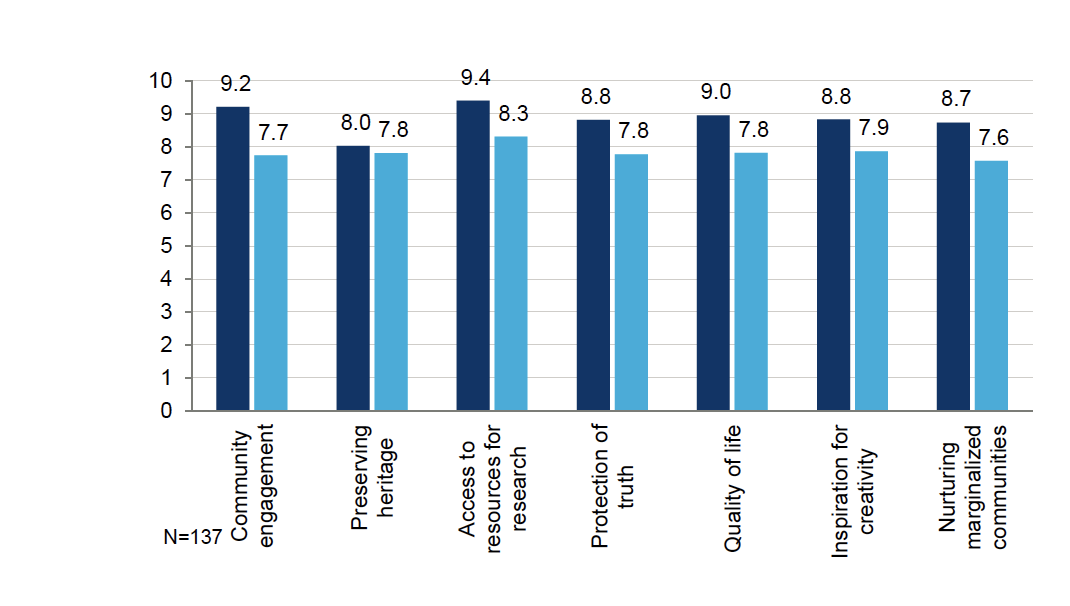
Figure description
Archives
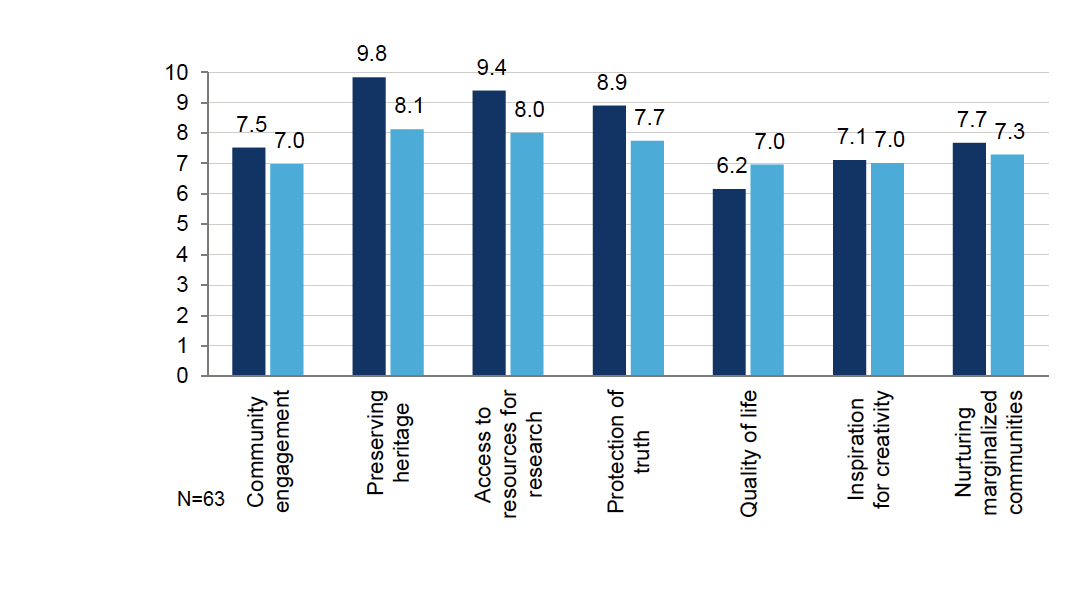
Figure description
Museums
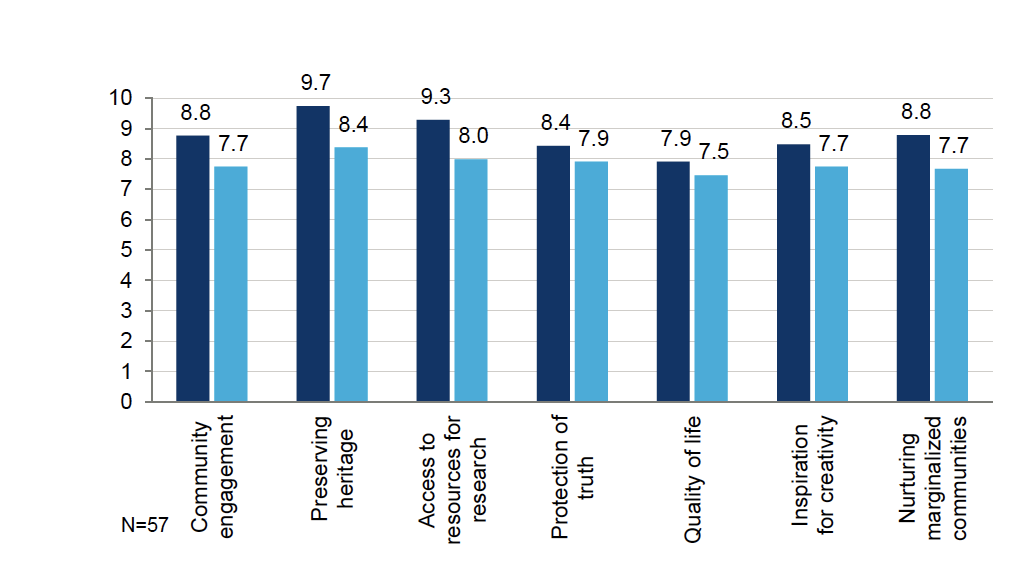
Figure description
Interestingly, when asked about effectiveness levels, stakeholders reported high levels of perceived effectiveness, especially in relation to the most important attributes (Fig. 27). However, effectiveness ratings tend to be lower than the importance ratings shown above. This is important, as, if stakeholders feel GLAMs—or certain types of GLAMs—are not as effective as they could be, it is relevant to understand the reasons behind this gap. As with the issue of importance above, perhaps the value lies in asking the question to begin with, rather than necessarily seeking the “right” answer. These data provide insights into such issues and offer a unique opportunity to initiate such debates.
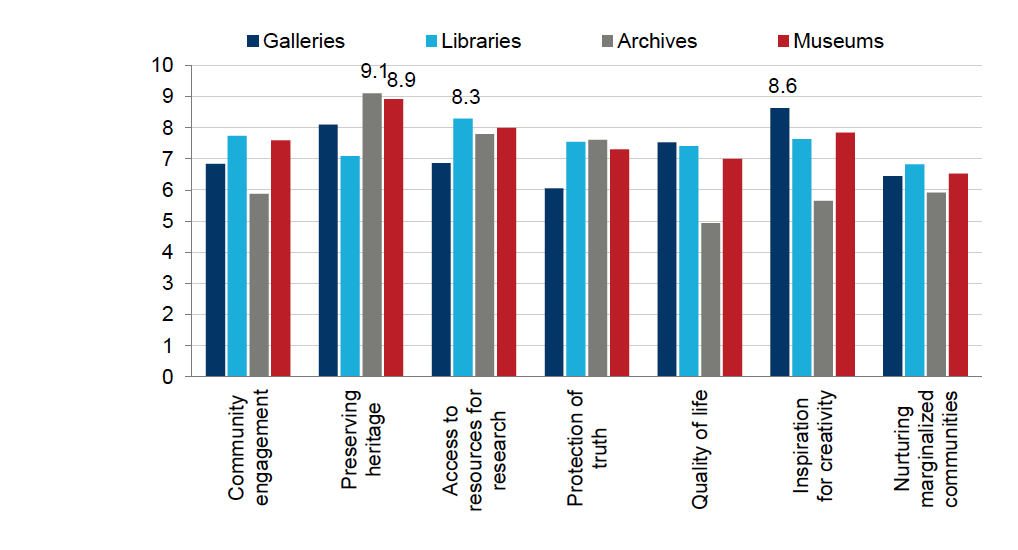
Figure description
Conclusion
The preceding chapters have presented estimates of the value generated by GLAMs to visitors, the perceived value attributed to them by non-users as well as online, educational and revenue values. We estimate the gross economic value of GLAMs to Canada in 2019 to have been $11.7 billion (Fig. 28). However, it is important to place this estimation of the gross value generated by the sector in context, by setting it against the costs of GLAMs operations, estimated at $3.0 billion in 2019. Dividing the value of quantified benefits by these costs gives a BCR of 3.9. This means that for each $1 spent operating GLAMs in 2019, $3.90 of benefits were generated for society in the same year, while net benefits totalled over $8.6 billion.
| $million 2019 | Galleries | Libraries | Archives | Museums | All GLAMs |
|---|---|---|---|---|---|
| Revenue | 222 | 31 | 22 | 451 | 727 |
| Non-Use value | 536 | 537 | 446 | 693 | 2,212 |
| Use value | 615 | 1,797 | 185 | 1,374 | 3,972 |
| Online usage | 378 | 636 | 353 | 277 | 1,644 |
| Educational value | 435 | 1,361 | 41 | 1,271 | 3,108 |
| Total benefits | 2,185 | 4,362 | 1,047 | 4,067 | 11,662 |
| Operating costs | 556 | 955 | 395 | 1,106 | 3,012 |
| Total costs | 556 | 955 | 395 | 1,106 | 3,012 |
| Benefit-Cost Ratio ( BCR) |
3.9 | 4.6 | 2.7 | 3.7 | 3.9 |
| Net benefits | 1,629 | 3,408 | 652 | 2,961 | 8,650 |
Source: Oxford Economics
The BCR of 3.9 is a powerful indicator of the sector’s value. While BCRs provide useful decision-making tools, caution must be exercised in comparing them across different types of investments, due to the use of different methodologies and components (for example, some studies may not include an assessment of non-use value). Further, one might have a low BCR attached to a project with a high net value in monetary terms.Footnote 108
It is nevertheless useful to compare the BCR identified above with similar studies of cultural institutions around the world. For example, the Americans for Libraries Council’s ( ALC) review of US libraries reported that a BCR of 3.1 or better was common among the studies it reviewed.Footnote 109 BCRs between 2.8 and 4.2 have also been recorded for Australian and New Zealand public libraries.Footnote 110 These and other similar results are presented below in Fig. 29.
In addition, due to the large size of the investments involved, transport economics is a common field of application for cost-benefit analyses. Examples of BCRs for infrastructure investments in Canada are also summarized in Fig. 29. Fig. 30 presents GLAMs’ BCR in context of major public infrastructure investment projects in Canada.
| Author | Year | Subject | Geography | BCR |
|---|---|---|---|---|
| Infrastructure studies, Canada | ||||
| Centre for Public Management Inc. | 2009 | Alaska Highway upgrading |
Canada | 1.5-2.6 |
| City of Markham | 2018 | Grey infrastructure |
Markham, Canada | 2.0-5.0 |
| Iacobacci | 2017 | Transit investments |
Greater Montreal, Greater Toronto, and Hamilton, Canada |
0.7-3.3 |
| Public library studies, global | ||||
| Aabø et al. | 2009 | National library studies |
Global | 3.0 (mean) 3.5 (median) |
| Educational value | 435 | 1,361 | 41 | 1,271 |
| Imholz et al. (ALC) | 2010 | US libraries | US | 3.1 |
| SGS Economics & Planning |
2013 | Public libraries | Australia | 2.9 |
| Strode et al. | 2012 | Reading rooms and lending services |
Latvia | 1.4 |
| Aabø | 2005 | Public libraries | Norway | 4.0 |
| Yanez | 2014 | Libraries | Spain | 2.8-3.8 |
| Kim | 2011 | Public libraries | Global | 3.8 ( CV) 4.5 (RP)Footnote 111 |
| Ko et al. | 2012 | Public libraries | Korea | 3.7 |
Source: Oxford Economics
All figures subject to rounding.
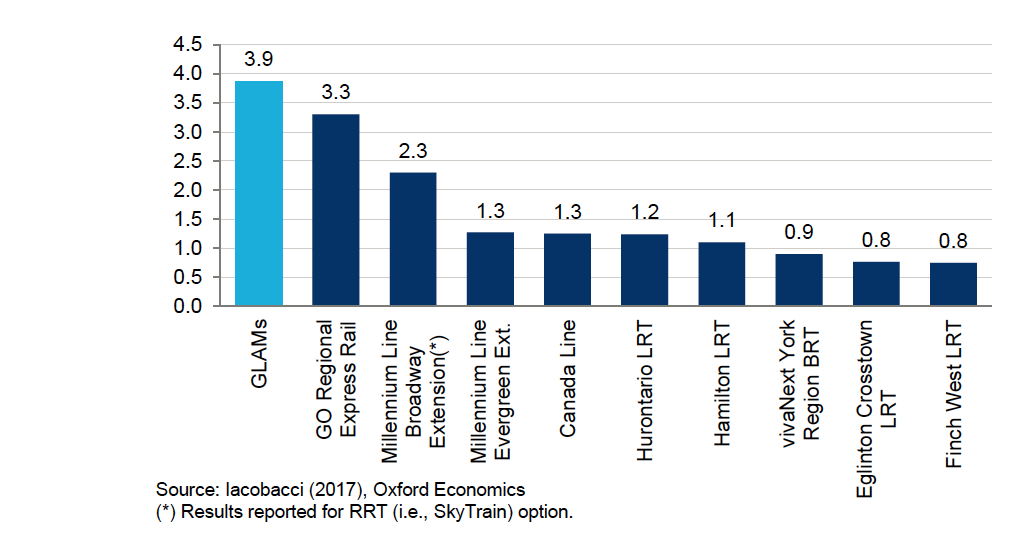
Figure description
These results provide one indication that GLAMs perform very favourably when compared to other major social investments. In essence, a dollar invested in GLAMs can potentially yield higher social returns then the investments in other commonly measured forms of investment, such as transportation infrastructure.Footnote 113
It should also be recalled that this report has provided a national level overview of a wide variety of institutions using a range of measurement tools. In considering ways forward for the sector and practical lessons, it is important that this work’s discussions and findings be further developed at the local, provincial and national levels, along with the tools used by the analysis itself. Even if no formal economic analysis is undertaken, the key categories of value explored in this report can act as an initial signpost to GLAMs in exploring their user base and how they add value to society.
For example, the travel cost analysis used in this report is derived from postal code data on the origin of GLAMs users. These or similar data could be collected more systematically and used for many other purposes such as examining exactly where users live through “heat maps” and the demographics of these neighbourhoods. This could help understand which communities GLAMs are providing services to and how well different population groups are represented. Likewise, closer monitoring of online services metrics, particularly social media, could provide additional insights into how GLAMs services are being used. Apart from understanding what is of particular interest to users, this could allow for the development of new GLAMs’ offerings which are geared to online engagement. More detailed data collection (e.g. via repeat surveys) on how users obtain both formal and informal educational benefits could be of use in understanding such benefits over the long term. This is especially so for informal education, where the long-term studies are lacking.
In considering broader effects, while Canada has been a world leader in recognising the wellbeing effects of GLAMs, further attention could also be paid to follow up data collection on how visitation is improving user quality of life. This would complement the national level data collection undertaken for this study.
Finally, the broader issues explored by the MCA in this study should not be forgotten. Individual GLAMs could explore not only how highly (or otherwise) users rate them on an agreed set of attributes, but also how effectively users see them as fulfilling their objectives and how such ratings compare with the perceptions of key stakeholders. This would allow for an assessment of whether and/or how GLAMs are fulfilling their mandate and whether the opinions of stakeholders differ from users in a systematic way.
At the same time, the limitations of the current study or any quantitative work should not be ignored. Some of these are detailed in the box below.
Limitations of the Current Study
Any major study involving a range of estimation techniques and quantitative methods, will be subject to limitations. A number of potential limitations relating to the current study are listed below:
- Population sample – As indicated, the current study sought to obtain a demographically representative sample of the Canadian population based on 2,045 participants using quotas to allow for age, gender, highest educational attainment, official language spoken and province. More extensive work could also seek to control for other factors such as employment status, and income (although these demographic questions were asked in the survey no specific quota samples were adopted). However, we believe that the current approach controls for most of the key demographic variables of interest. Additional demographic variables might be highly correlated with these ones already allowed for (e.g. income could be closely related to educational status).
- Institutional sample – Data for the travel cost and online modelling included information sourced from a number of GLAMs responding to data requests, as indicated above. Given the large number of GLAMs across Canada, and the fact that it was obviously not possible to include every GLAM in this sample, this raises the question of the representativeness of the data supplied. Note however that the analysis sought to address this by collecting data from as many GLAMs of varying sizes and geographical locations across the country as possible and, most significantly, by combining “top down” national survey data with the “bottom up” data collected from individual institutions. In the case of archives, the data set was further supplemented by the use of extensive unpublished data supplied by Professor Wendy Duff.
- Non-use valuation – There is a large literature on the approaches using stated preference estimations to derive willingness to pay and potential biases in estimation. Some of these are detailed in the chapter of this report dealing with non-use value. As described in that chapter, we have attempted to address these biases by paying careful attention to question wording and presentation. Nonetheless, as this valuation is inherently subjective, this issue may never be fully resolved. Future analysis may seek to use more advanced techniques such as choice modelling, which adopt further measures to deal with the issue of respondent bias.
- Non- CULC and non-CARL libraries- While good data exists for CULC libraries, information for non- CULC libraries was found to be less comprehensive, as it was organised into provincial data with varying levels of detail. As indicated in the discussion of library valuation above, values were therefore based on data for CULC libraries, supplemented by an estimation for non- CULC libraries. This allowed for a derivation of an estimate for the entire public library sector. In addition, as indicated, academic library estimations were based on CARL data only, as, while partial data were available, comprehensive non-CARL data did not appear to be available at the national level. Future work could seek to address these data issues and refine the estimations made in this study.
- Scope - The current study does not distinguish between the usage of GLAMs by Canadians and foreigners (e.g. tourists visiting GLAMs, foreign users of GLAMs websites). The benefits from using GLAMs accrue to users regardless of whether they are Canadian residents or not. However, most of the costs of supporting GLAMs would be incurred by Canadian society. We took a view that GLAMs are a benefit not only to Canadians but to global society as a whole and therefore the study should be global in scope. However, a more restrictive approach would have seen benefits restricted to Canadians and matched against the costs incurred by Canadian society.
As with all research and empirical work, future work could seek to extend knowledge to deal with these limitations in more detail.
Finally, it is also worth pointing out that many of the valuations in the current study have been developed on the basis of individual preferences, whether revealed (e.g. using the TCM) or stated (e.g. non-use value). This is consistent with standard economic frameworks, which emphasise the importance of such preferences in valuing goods and services and making decisions. Nonetheless, it may be that “the whole is greater than the sum of the parts”. That is, GLAMs may offer broader social benefits above and beyond what an assessment of individual preferences can provide. Some of these concepts were explored in the discussions in the wider benefits chapter of this report, particularly those relating to social capital and spillover effects, which encompass the idea that the value of GLAMs themselves may be above and beyond what any individual user (or non-user) might perceive.